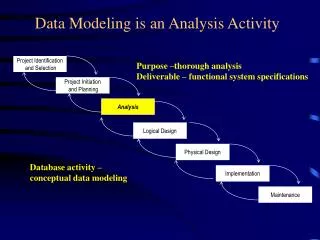
Project F2: Application Performance Analysis
Seth Koehler John Curreri Rafael Garcia. Project F2: Application Performance Analysis. Outline. Introduction Performance analysis overview Historical background Performance analysis today Related research and tools RC performance analysis Motivation Instrumentation Framework

Project F2: Application Performance Analysis
E N D
Presentation Transcript
Seth Koehler John Curreri Rafael Garcia Project F2: Application Performance Analysis
Outline • Introduction • Performance analysis overview • Historical background • Performance analysis today • Related research and tools • RC performance analysis • Motivation • Instrumentation • Framework • Visualization • User’s perspective • Case studies • N-Queens • Collatz (3x+1) conjecture • Conclusions & References
Introduction • Goals for performance analysis in RC • Productively identify and remedy performance bottlenecks in RC applications (CPUs and FPGAs) • Motivations • Complex systems are difficult to analyze by hand • Manual instrumentation is unwieldy • Difficult to make sense of large volume of raw data • Tools can help quickly locate performance problems • Collect and view performance data with little effort • Analyze performance data to indicate potential bottlenecks • Staple in HPC, limited in HPEC, and virtually non-existent in RC • Challenges • How do we expand notion of software performance analysis into software-hardware realm of RC? • What are common bottlenecks for dual-paradigm applications? • What techniques are necessary to detect performance bottlenecks? • How do we analyze and present these bottlenecks to a user?
Historical Background • Gettimeofday and printf • VERY cumbersome, repetitive, manual, not optimized for speed • Profilers date back to 70’s with “prof” (gprof, 1982) • Provide user with information about application behavior • Percentage of time spent in a function • How often a function calls another function • Simulators / Emulators • Too slow or too inaccurate • Require significant development time • PAPI (Performance Application Programming Interface) • Portable interface to hardware performance counters on modern CPUs • Provides information about caches, CPU functional units, main memory, and more * Source: Wikipedia
Performance Analysis Today • What does performance analysis look like today? • Goals • Low impact on application behavior • High-fidelity performance data • Flexible • Portable • Automated • Concise Visualization • Techniques • Event-based, sample-based • Profile, Trace • Above all, we want to understand application behavior in order to locate performance problems!
Related Research and Tools: Parallel Performance Wizard (PPW) • Open-source tool developed by UPC Group at University of Florida • Performance analysis and optimization (PGAS* systems and MPI support) • Performance data can be analyzed for bottlenecks • Offers several ways of exploring performance data • Graphs and charts to quickly view high-level performance information at a glance [right, top] • In-depth execution statistics for identifying communication and computational bottlenecks • Interacts with popular trace viewers (e.g. Jumpshot [right, bottom]) for detailed analysis of trace data • Comprehensive support for correlating performance back to original source code * Partitioned Global Address Space languages allow partitioned memory to be treated as global shared memory by software.
Debug Sequential Performance Debug Parallel Performance Debug Dual-Paradigm Performance Motivation for RC Performance Analysis • Dual-paradigm applications gaining more traction in HPC and HPEC • Design flexibility allows best use of FPGAs and traditional processors • Drawback: More challenging to design applications for dual-paradigm systems • Parallel application tuning and FPGA core debugging are hard enough! Less Difficultylevel More • No existing holistic solutions for analyzing dual-paradigm applications • Software-only views leave out low-level details • Hardware-only views provide incomplete performance information • Need complete system view for effective tuning of entire application
Motivation for RC Performance Analysis • Q: Is my runtime load-balancing strategy working? • A: ??? ChipScope waveform
Motivation for RC Performance Analysis • Q: How well is my core’s pipelining strategy working? • A: ??? Flat profile: Each sample counts as 0.01 seconds. % cumulative self self total time seconds seconds calls ms/call ms/call name 51.52 2.55 2.55 5 510.04 510.04 USURP_Reg_poll 29.41 4.01 1.46 34 42.82 42.82 USURP_DMA_write 11.97 4.60 0.59 14 42.31 42.31 USURP_DMA_read 4.06 4.80 0.20 1 200.80 200.80 USURP_Finalize 2.23 4.91 0.11 5 22.09 22.09 localp 1.22 4.97 0.06 5 12.05 12.05 USURP_Load 0.00 4.97 0.00 10 0.00 0.00 USURP_Reg_write 0.00 4.97 0.00 5 0.00 0.00 USURP_Set_clk 0.00 4.97 0.00 5 0.00 931.73 rcwork 0.00 4.97 0.00 1 0.00 0.00 USURP_Init gprof output (×N, one for each node!)
0 1 2 3 Core Core Core Core Core Core Core Core Core Core Core Core What to Instrument in Hardware? • Control • Watch state machines, pipelines, etc. • Replicated cores • Understand distribution and parallelism inside FPGA • Communication • On-chip (Components, Block RAMs, embedded processors) • On-board (On-board memory, other on-board FPGAs or processors) • Off-board (CPUs, off-board FPGAs, main memory)
Instrumentation Modifications Color Legend Framework User Application Process is automatable! Additions are temporary!
Performance Analysis Framework • Instrument VHDL source (vs. binary or intermediate levels) • Portable across devices • Flexible (access to signals) • Low change in area / speed (optimized) • Relatively easy • Must pass through place-and-route • Language specific (VHDL vs. Verilog) • Store data with CPU-initiated transfers (vs. CPU-assisted or FPGA-initiated) • Universally supported • Not portable across APIs • Inefficient (lock contention, wasteful) • Lower fidelity Request CPU FPGA Data
Hardware Measurement Extractation Module • Separate thread (HMM_Main) periodically transfers data from FPGA to memory • Adaptive polling frequency can beemployed to balance fidelity and overhead • Measurement can be stopped andrestarted (similar to stopwatch) HMM_Init HMM_Start HMM_Main (thread) Application HMM_Stop HMM_Finalize
Instrumentation Modifications (cont) • New top-level file arbitrates between application and performance framework for off-chip communication • Splice into communication scheme • Acquire address space in memory map • Acquire network address or other unique identifier • Connect hardware together • Signal analysis • Challenges in Automation • Custom APIs for FPGAs • Custom user schemes for communication • Application knowledge not available
Hardware Measurement Module • Tracing, profiling, & sampling with signal analysis
Visualization • Need unified visualizations that accentuate important statistics • Must be scalable to many nodes
Analysis • Instrument and measure to locate common or expected bottlenecks • Provide potential solutions or other aid to mitigate these bottlenecks • Best practices, common pitfalls, etc • Hardware/platform specific checks and solutions
Performance flow (user’s perspective) • Instrument hardware through VHDL Instrumenter GUI • Java/Perl program to simplify modifications to VHDL for performance analysis • Must resynthesize & implement hardware • Requires adding in instrumented HDL file via standard tool flow • Instrument software through PPW compiler scripts • Run software with ppwupcc instead of standard compiler • Use –fpga-nallatech and –inst-functions command line options
Q Q Q Q Case Study: N-Queens* • Overview • Find number of distinct ways n queens can be placed on an nxn board without attacking each other • Performance analysis overhead • Sixteen 32-bit profile counters • One 96-bit trace buffer (completed cores) • Main state machine optimized based on data • Improved speedup (from 34 to 37 vs. Xeon code) FPGAs * Standard backtracking algorithm employed
Case study: Collatz conjecture (3x+1) • Application • Search for sequences that do not reach 1 under the following function • 3.2GHz P4-Xeon CPU with Virtex-4 LX100 FPGA over PCI-X • Uses 88% of FPGA slices, 22% (53) of block RAM, runs at 100MHz • Setup • 17 counters monitored 3 state machines • No frequency degradation observe • Results • Frequent, small FPGA communication • 31% performance improvement achieved by buffering data before sending to the FPGA • Unexpected...hardware was tuned to work longer to eliminate communication problems • Distribution of data inside FPGA • Expected performance increase not large enough to merit implementation • Conclusions • Buffering data achieved 31% increase in speed FPGA Write FPGA Read FPGA Data Processing Computation FPGA Read FPGA Write
Conclusions • RC performance analysis is critical to understanding RC application behavior • Need unified instrumentation, measurement, and visualization to handle diverse and massively parallel RC systems • Automated analysis can be useful for locating common RC bottlenecks (though difficult to do) • Framework developed • First RC performance concept and tool framework (per extensive literature review) • Automated instrumentation • Measurement via tracing, profiling, & sampling • Application case-studies • Observed minimal overhead from tool • Speedup achieved due to performance analysis
References • R. DeVille, I. Troxel, and A. George. Performance monitoring for run-time management of reconfigurable devices. Proc. of International Conference on Engineering of Reconfigurable Systems and Algorithms (ERSA), pages 175-181, June 2005. • Paul Graham, Brent Nelson, and Brad Hutchings. Instrumenting bitstreams for debugging FPGA circuits. In Proc. of the the 9th Annual IEEE Symposium on Field-Programmable Custom Computing Machines (FCCM), pages 41-50, Washington, DC, USA, Apr. 2001. IEEE Computer Society. • Sameer S. Shende and Allen D. Malony. The Tau parallel performance system. International Journal of High Performance Computing Applications (HPCA), 20(2):287-311, May 2006. • C. EricWu, Anthony Bolmarcich, Marc Snir, DavidWootton, Farid Parpia, Anthony Chan, Ewing Lusk, and William Gropp. From trace generation to visualization: a performance framework for distributed parallel systems. In Proc. of the 2000 ACM/IEEE conference on Supercomputing (CDROM) (SC), page 50, Washington, DC, USA, Nov. 2000. IEEE Computer Society. • Adam Leko and Max Billingsley, III. Parallel performance wizard user manual. http://ppw.hcs.ufl.edu/docs/pdf/manual.pdf, 2007. • S. Koehler, J. Curreri, and A. George, "Challenges for Performance Analysis in High-Performance Reconfigurable Computing," Proc. of Reconfigurable Systems Summer Institute 2007 (RSSI), Urbana, IL, July 17-20, 2007.