
Enhancing Online Survey Quality Through Automated Analysis and Data Visualization
This project extends the AutoMan framework to automate human-based computation tasks via online surveys. By integrating quality control measures, we aim to filter out low-quality responses and improve data integrity through metrics and visualizations. The Survey Entropy Classifier evaluates response uncertainty, using bootstrap resampling to identify outlier responses. Key insights include developing clustering techniques to identify populations of answers and fostering collaboration within research environments. Supported by the NSF's Research Experience for Undergraduates program, this research focuses on extracting meaningful results from crowdsourced data.

Enhancing Online Survey Quality Through Automated Analysis and Data Visualization
E N D
Presentation Transcript
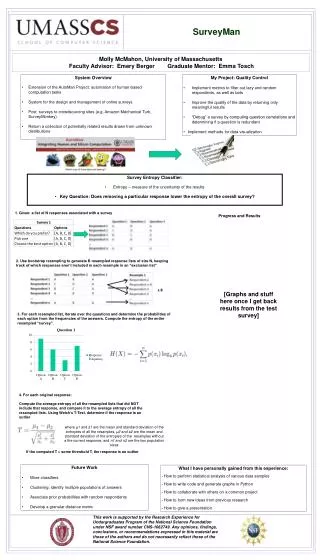
SurveyMan Molly McMahon, University of Massachusetts Faculty Advisor: Emery Berger Graduate Mentor: Emma Tosch • System Overview • Extension of the AutoMan Project: automation of human-based computation tasks • System for the design and management of online surveys • Post surveys to crowdsourcing sites (e.g. Amazon Mechanical Turk, SurveyMonkey) • Return a collection of potentially related results drawn from unknown distributions • My Project: Quality Control • Implement metrics to filter out lazy and random respondents, as well as bots • Improve the quality of the data by returning only meaningful results • “Debug” a survey by computing question correlations and determining if a question is redundant • Implement methods for data visualization • Survey Entropy Classifier: • Entropy – measure of the uncertainty of the results • Key Question: Does removing a particular response lower the entropy of the overall survey? 1. Given: a list of N responses associated with a survey Progress and Results 2. Use bootstrap resampling to generate B resampled response lists of size N, keeping track of which responses aren’t included in each resample in an “exclusion list” [Graphs and stuff here once I get back results from the test survey] 3. For each resampled list, iterate over the questions and determine the probabilities of each option from the frequencies of the answers. Compute the entropy of the entire resampled “survey”. 4. For each original response: Compute the average entropy of all the resampled lists that did NOT include that response, and compare it to the average entropy of all the resampled lists. Using Welch’s T-Test, determine if the response is an outlier where µ1 and s1 are the mean and standard deviation of the entropies of all the resamples, µ2 and s2 are the mean and standard deviation of the entropies of the resamples without a the current response, and n1 and n2 are the two population sizes If the computed T > some threshold T, the response is an outlier • Future Work • More classifiers • Clustering: identify multiple populations of answers • Associate prior probabilities with random respondents • Develop a granular distance metric What I have personally gained from this experience: • How to perform statistical analysis of various data samples • How to write code and generate graphs in Python • How to collaborate with others on a common project • How to form new ideas from previous research • How to give a presentation This work is supported by the Research Experience for Undergraduates Program of the National Science Foundation under NSF award number CNS-1062749. Any opinions, findings, conclusions, or recommendations expressed in this material are those of the authors and do not necessarily reflect those of the National Science Foundation.