Download
1 / 31
590 likes | 1.76k Views
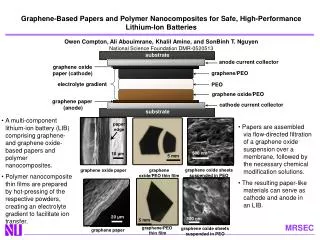
OXIDE AND INTERFACE TRAPPED CHARGES, OXIDE THICKNESS. Yameng Bao Yameng.bao@aalto.fi Electron Physics Group. Outline. 1.Introduction 2. Fixed Oxide Trapped, and Mobile Oxide Charge 3. Interface Trapped Charge 4. Oxide Thickness 5. Strengths and Weaknesses. 1.Introduction.

E N D
OXIDE AND INTERFACE TRAPPEDCHARGES, OXIDE THICKNESS YamengBao Yameng.bao@aalto.fi Electron Physics Group
Outline • 1.Introduction • 2. Fixed Oxide Trapped, and Mobile Oxide Charge • 3. Interface Trapped Charge • 4. Oxide Thickness • 5. Strengths and Weaknesses
1.Introduction • Capacitance-voltage and oxide thickness measurements must be more carefully interpreted for thin, leaky oxides • Charges and defects in the oxide • Variable Capacitance • Insulation and passivation • High dielectric constant • Low leakage current and low tunnel current-lower power waste lower temperature of device • Focus on SiO2-Si system
(1). Interface Trapped Charge(Qit ,Nit, Dit) • (2). Fixed Oxide Charge(Qf, Nf) • (3) Oxide Trapped Charge (Qot , Not ) • (4) Mobile Oxide Charge (Qm,Nm)
Oxide Charges • (1) Interface Trapped Charge(Qit) • Due to structural defects, oxidation-induced defects, metal impurities, or other defects caused by radiation or similar bond breaking processes • Unlike fixed charge or trapped charge interface trapped charge is in electrical communication with the underlying silicon • Could be neutralized by low T H2 or forming Gas(N2&H2)
Oxide Charges • (2) Fixed Oxide Charge(Qf)(near the interface) • Coming from oxidation process • Usually measure after Annealing to eliminate the effect of the interface trapped charge • It depends on final oxidation temperature • Always present in any cases
Oxide Charges • (3) Oxide Trapped Charge(Qot) • Due to the ionizing radiation, avalanche injection and so on • Sometimes could be annealed by Low-T treatment but the neutral traps still remain • (4) Mobile Oxide Charge(Qm) • Caused by Na+, Li+, K+ and so on • Chlorine atom may reduce this charge
2. Fixed Oxide Trapped, and Mobile Oxide Charge (1) Capacitance-voltage Curve QG is gate charge density VG is gate voltage QG =-(Qs + Qit) Qs is semiconductor charge density Qitis interface charge density V G = V FB + V ox + φ s VFBisflatband voltage V oxis oxide voltage φ sis surface potential Q S = Q p +Q b + Q n Qpis hole charge density, Qbis space-charge region bulk charge density Qnis electron charge density
2. Fixed Oxide Trapped, and Mobile Oxide Charge V > 0 V >> 0 (1) Capacitance-voltage Curve V < 0 • Accumulation • Strong inversion • Depletion For P type substrate
2. Fixed Oxide Trapped, and Mobile Oxide Charge (1) Capacitance-voltage Curve For negative gate voltages Accumulation: 1) Big negative voltage Qpdominates . Cp is short circuit
2. Fixed Oxide Trapped, and Mobile Oxide Charge (1) Capacitance-voltage Curve Depletion Small negative voltage and small positive voltage Qb=-qNAW In week inversion Cnbegin to appear Strong inversion Cn domains a) If the inversion charge could follow the HF-AC, C=Cox b) if the inversion could not follow, C=Cox+Cb
2. Fixed Oxide Trapped, and Mobile Oxide Charge (1) Capacitance-voltage Curve When the dc bias voltage is changed rapidly with insufficient time for inversion charge generation, the deep-depletion curve results. Its high- or low-frequency semiconductor capacitance is Cdd Effect of sweep direction and sweep rate on the hf MOS-C capacitance on p-substrate,
2. Fixed Oxide Trapped, and Mobile Oxide Charge (2) Flatband Voltage The flatband voltage is determined by the metal-semiconductor work function difference φMSand the various oxide charges through the relation Interface trapped charge Metal-S work function different Charges in oxide Charges in metal Fixed charge Determine the VFB
2. Fixed Oxide Trapped, and Mobile Oxide Charge High Frequency: High-frequency C – V curves are typically measured at 10 kHz – 1 MHz. (3) Capacitance Measurement Using a phase sensitive detector, one can determine the conductance G or the capacitance C, knowing R and ω = 2πf
2. Fixed Oxide Trapped, and Mobile Oxide Charge Low Frequency: Current-Voltage (3) Capacitance Measurement Low Frequency: Current-Voltage: The low-frequency capacitance of an MOS-C is usually not obtained by measuring the capacitance, but rather by measuring a current or a charge, because capacitance measurements at low frequencies are very noisy. Low F High F
2. Fixed Oxide Trapped, and Mobile Oxide Charge Low Frequency: Current-Voltage and Charge-Voltage (3) Capacitance Measurement Q-V is more suitable for MOS measurement
2. Fixed Oxide Trapped, and Mobile Oxide Charge (4) Fixed Charge a) The fixed charge is determined by comparing the flatband voltage shift of an experimental C – V curve with a theoretical curve and measure the voltage shift To determine Qf,one should eliminate or at least reduce the effects of all other oxide charges and reduce the interface trapped charge to as low a value as possible. Qit is reduced by annealing in a forming gas. b) Second method using differing tox Plot VFBversus tox with slope Qf/Kox ε0 and intercept φMS . This method, requires MOS capacitors with differing tox.However, it is more accurate because it is independent of φMS . Koxis semiconductor dielectric constant
2. Fixed Oxide Trapped, and Mobile Oxide Charge (5) Work function difference φ MS depends on oxidation temperature, wafer orientation, interface trap density, and on the low temperature Dit anneal (6) Oxide Trapped Charge(Qot) The distribution of Qotmust be known for proper interpretation of C –V curves. Trapped charge distributions are measured most commonly by the etch-off and the photo I –V methods • A determination of the charge distribution in the oxide is tedious and therefore not • routinely done. In the absence of such information, the Vfb shift due to charge injection is generally interpreted by assuming the charge is at the oxide-semiconductor interfaceusing the expression
2. Fixed Oxide Trapped, and Mobile Oxide Charge Mobile charge in SiO 2 is due primarily to the ionic impurities Na+, Li+, K+, and perhaps H+. Sodium is the dominant contaminant. (5) Mobile Charge • Bias-Temperature Stress( BTS): Measured at 250C, under gate bias, measure CV then cool down to 25C, then measure CV, the Qm is determined by Vfb shift. • Triangular voltage sweep (TVS) method: Clf and Chf measured at T=250C, The Qm is determined from the area between the two curves
3. Interface trapped charge Experimental-LF (1) Low frequency(Quasi-static) methods HF LF Effect of D it on MOS-C capacitance-voltage curves. (a) Theoretical high-frequency,(b) theoretical low-frequency and (c) experimental low-frequency curves. Gate voltage stress generated interface traps Interface traps do respond to the probe frequency at LF, and the curve distorts because the interface traps contribute interface trap capacitance Citand the curve stretches out along the voltage axis This stretch-out is not the result of interface traps contributing excess capacitance, but rather it is the result of the C –V curve stretch-out along the gate voltage axis
3. Interface trapped charge (1) Low frequency(Quasi-static) methods ΔC/Cox =Clf/Cox− Chf/Cox
3. Interface trapped charge One of the most sensitive methods to determine D it Interface trap densities of 109 cm− 2eV− 1and lower can be measured. (2) Conductance Method The conductance is measured as a function of frequency and plotted as G P /ω versus ω. GP/ω has a maximum at ω =1/τ it and at that maximum Dit=2GP/qω. we find ω ≈ 2/τ it and D it=2.5GP/qωat the maximum. Hence we determine D it from the maximum G P /ω and determine τ it from ω at the peak conductance location on the ω-axis.
3. Interface trapped charge (3)High Frequency Method Terman Method: In HF CV, interface traps do not respond to the ac probe frequency, they do respond to the slowly varying dc gate voltage and cause the hf C –V curve to stretch out along the gate voltage axis as interface trap occupancy changes with gate bias ΔV G = V G –V G (ideal) is the voltage shift of the experimental from the ideal curve, and V G the experimental gate voltage The method is generally considered to be useful for measuring interface trap densities of 10 10cm− 2eV− 1and above
3. Interface trapped charge (3)High Frequency Method Gray-Brown and JenqMethod:, the CHFmeasured as a function of T. Reducing the T causes the Fermi level to shift towards the majority carrier band edge and the interface trap time constant τ it increases at lower T. Hence interface traps near the band edges should not respond to typical ac probe frequencies at low T whereas at room temperature they do respond. This method should extend the range of interface traps measurements to D it near the majority carrier band edge Compared with DLTS?
3. Interface trapped charge (4)Other Methods 1.Charge Pumping 3. DC-IV method 2. MOSFET Sub-threshold Current method 3. DC-IV method 4. deep-level transient spectroscopy(DLTS) 5. charge-coupled devices (CCD) 6. electron spin resonance (ESR)
3. Oxide thickness C –V , I –V , ellipsometry, transmission electron microscopy(TEM), X-ray photoelectron spectroscopy (XPS), medium energy ion scattering spectrometry (MEIS), nuclear reaction analysis (NRA), Rutherford backscattering (RBS), elastic backscattering spectrometry (EBS), secondary ion mass spectrometry (SIMS), grazing incidence X-ray reflectometry (GIXRR), and neutron reflectometry (1)Capacitance-Voltage(equivalent electrical thickness)
3. Oxide thickness The current flowing through an insulator is either Fowler-Nordheim (FN) or direct tunnel current (2)Current-Voltage (a) V ox < qφB(direct tunneling) (b) V ox > qφBFowler-Nordheim tunneling
3. Oxide thickness (3)Other methods Ellipsometry: Suitable for oxides into the 1–2 nm regime. Variable angle, spectroscopic ellipsometry is especially suited for oxide thickness measurements Transmission Electron Microscopy is very precise and usable to very thin oxides, but sample preparation is tedious X-ray Photoelectron Spectroscopy
4. Strength and Weakness (1)Mobile Oxide Charge Bias temperature stress method Conductance method • Requiring the measurement of a C –V at different Ts • Total mobile charge density will be measured, No separation • high sensitivity, majority carrier capture cross sections • Limited surface potential range Triangular voltage sweep method Quasi-static method(I-V/Q-V) • Could differentiate different mobile charges, high sensitivity, fast • Increasing oxide leakage current for thin film • Easy to measure, large surface potential range • I-V the requirement for I-V, current is low • For I-V and Q-V leakage current could be a big problem (2) Interface tapped charge(conductance and low frequency method
4. Strength and Weakness (3)Oxide Thickness • MOS C –V measurements are most common. • Leakage current make the result much difficult • I-V used for thickness extraction • Ellipsometry is mostly used for thickness, very sensitive to thin oxides • XPS suitable for very thin oxide
5. Questions? • All the charges seems affect each other during the measurement. • For thin oxide, the tunnel current or leakage current will effect the result. • Real measurement is always not as simple as description in the book!O(∩_∩)O