Download
1 / 68
680 likes | 1.02k Views
QI Roadmap. Where are we?. Find Public Health. QI. What is the Roadmap?. http://qiroadmap.org /. Foundational Elements of QI Culture. Leadership Commitment. QI infrastructure PM system PM/QI Council QI Plan. Customer Focus. Teamwork and Collaboration.

E N D
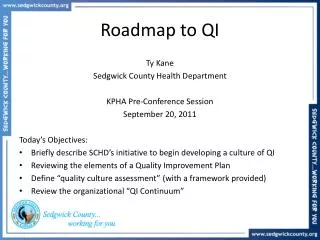
QI Roadmap Where are we?
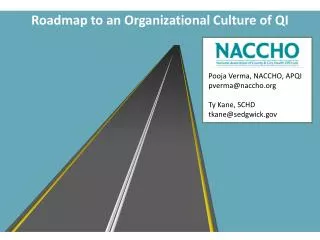
What is the Roadmap? http://qiroadmap.org/
Foundational Elements of QI Culture Leadership Commitment QI infrastructure PM system PM/QI Council QI Plan Customer Focus Teamwork and Collaboration Continuous Process Improvement Employee empowerment and commitment
Phases of QI Culture 6 Culture of QI 5 4 Formal, agency wide QI 3 2 Formal QI activities in certain areas Informal or ad-hoc Not involved in QI activities 1 No knowledge of QI
6 Where did DHSS begin? 5 4 3 2 • No QI plan or policy or committee • QI is not an expectation for staff • Limited Understanding of QI • Few expectations of staff to engage in QI • QI is a trend or temporary • Training opportunities are few • Very few QI champions exist • Problems are randomly or inconsistently addressed • Simple, informal elements of QI exist (e.g., evaluation • activities, some data collection). • Resources and staff time allocated for QI are very • limited. 1
6 Where are we now? 5 4 3 2 • QI Plan and policies are in place • QI committee established • Many staff have QI as an expectation • Some QI champions are able to lead QI projects and mentor staff • Basic QI training are available, but advanced QI training is limited • Several staff are embracing QI as a means to improve daily work • Data-driven decision-making is used over reactive problem-solving • Use of a formal QI model is institutionalized in some areas • Redundancies and variations in some process are being addressed • Staff may view QI as an added responsibility • QI efforts are often stalled due to emerging issues (e.g., budget cuts, • staff turnover, H1N1 response). 1
QI Committee • QI Committee (policy 15.11) • Assess and identifying annual strategies • Annual review of the department’s QI Plan and policy. • Review submissions for the Governor’s Award for Quality and Productivity. • Carry out actions necessary to meet the accreditation standards • Identify projects in their divisions and providing TA • Share the progress of QI Committee • Identify potential cross-divisional and cross-departmental projects
QI Plan • Goals: • Increase employee empowerment and commitment • Training • QI Projects • Recognition • Increase Leadership Commitment • Assessment of culture • Communication to staff • Infrastructure • Training • QI expectations
Where is your unit? Table Activity – 20 Min Discussion – 10 Min
Strategies for moving on down the road Table Activity – 20 Min Discussion – 10 Min
HIV Viral Suppression Quality Improvement Project Craig Highfill Director of Prevention and Field Operations Bureau of HIV, STD, and Hepatitis
HIV Cross-part Care Continuum Collaborative (H4C) • Health Resources and Services Administration (HRSA)/National Quality Center (NQC) project • Five states selected • September 2013 - December 2016 • Primary goal • HIV viral suppression • Use of HIV Care Continuum
H4C Response Team Members • Bureau of HIV, STD, and Hepatitis • Bureau of Reportable Disease Informatics • Ryan White Program Partners • Ryan White Grant Recipients • Ryan White Program Consumers • NQC Quality Improvement Coach
H4C Response Team Meetings • Monthly In-person Meetings • Coordinated by BHSH • Facilitated by Ryan White Part B (BHSH) and another Ryan White Grantee • Bi-annual meetings with HRSA and NQC • Report progress • Action Planning
AIM Statement Missouri will improve the HIV Care Continuum in order to provide high quality care for Missouri residents living with HIV. We will initially focus on viral load suppression, as evidenced by: • At least 85% of patients in all race, gender, and age categories will be virally suppressed by December 2016 from the baseline of 80.7% in December of 2013
Quality Improvement Activities • Case Management QI projects • PDSA Cycles • Client Education by Peers • Consumer Quality Training • Quarterly H4C Newsletter
Measuring Improvement • Bi-monthly data submissions • Stratified by age, gender, race • Annual closed cohort data submissions • Monitored viral load of unsuppressed clients from baseline data submission • Data Sources • Clinic electronic medical records • Surveillance (BRDI)
Impact of Improvement Efforts on Staff and Program Partners • Increased focus on viral suppression • Statewide Quality Management Plan • Improved data collection • Staff/consumer development in QI • 175 participants in community QI trainings • 27 graduates of Training Consumers on Quality (TCQ) • Tangible outcomes of program efforts
Outcomes • Achievement of AIM Statement Goal • Viral Load Suppression increased from 80.7% to 87.1% • Statewide Quality Improvement Team was formed and is still active • Monthly meetings held at DHSS
Outcomes • Significant viral load suppression increase in a population with the lowest suppression rates • African Americans showed the greatest overall improvement (from 76.98% to 85.97%) • Exceeded closed cohort viral load suppression goal (goal=20% increase) • Achieved a 46.8% increase in viral load suppression
Challenges Time Commitment Data Source Limitations Data Delay/Impact of QI Efforts Coordination of tasks among Response Team members
DRL Compensatory Time Reduction
Issue Nature of the beast- DRL staff travel extensively. Surveys and complaints do not occur in 8 or 10 hour day increments. Overtime liability was burdensome in face of decreasing budget and policy changes. Longer hold times on vacancies for leave payouts.
Changes implemented Reduced allowed amount of accrued compensatory time to 40 hours. Overtime worked must have a justificationentered in Delta. All overtime worked must be pre approved- no blanket approvals. If staff go over 40 hours, an internal work plan must be implemented to reduce time within 3 months.
Rising Above the Status Quo Institute of Management Excellence Quality Improvement Pat Olson, Senior Public Health Lab Scientist June 27, 2017
What Prompted QI Project • In 2014, APHL/CDC announced new national standards for TB laboratories • Receive ≥67% clinical specimens for TB testing within 24 hours after collection • The longer it takes for samples to get to the laboratory it becomes increasingly difficult to isolate TB due to normal flora contamination • Rapid delivery provides effective TB control interventions to quickly diagnose active TB disease cases
Data Used for Determination • Historical data since 2009 • 33% specimens were received within 24 hours • Turn-around time data from Laboratory Information Management System (LIMS) • Lapsed time between specimen collected to specimen received in the laboratory • Laboratory contamination rates
Team Members • TB Laboratory Staff • TB Elimination Program • Hospitals and Local Public Health Agencies (LPHA)
S.M.A.R.T. Goal National Standard Receive in the laboratory greater than 67% of clinical specimens for TB testing within 24-hours of specimen collection by 2019
Metrics Used to Measure Success • TAT data of lapsed time between specimen collection to specimen received in the laboratory • TAT data from specimen receipt to diagnosis of active TB disease (e.g. NAAT) • Overall contamination rate
Initial Process of New Goal • “Dear Colleague” letter sent to all MSPHL customers with information of the new national standard • Letter outlined importance of rapid delivery and how data will be monitored and shared (e.g. quarterly reports)
Laboratory Quarterly Reports • Data/Progress shared using quarterly statements • Data provided by Laboratory LIMS • Exclusive quarterly statements sent to LPHA to monitor progress • Total number of specimens received within 24, 48 and 72 hours • Percentage of specimens received within 24 hours • Cumulative percentage of specimens received in the reporting year • Provided statewide progress to meeting national standard
Challenges/Obstacles Encountered • Additional outreach required beyond “Dear Colleague” letter • New laboratory contracted courier • Courier specimen pick-up times changed • Clinic operating hours after courier pick-up • Rural versus Urban (i.e. batching specimens more convenient)
Overcoming Obstacles • Conference calls with LPHA’s not meeting the new submission standard • Face-to-face visit with some LPHA TB clinics to identify opportunities for improvement • Provided best practice of collecting samples • Reviewed clinic operations and processes • Consulted with laboratory courier liaison to request change of pick-up times to coincide after TB clinic operation
Cycles of learning encouraged new specimen acceptance criteria • Quality Improvement process identified additional opportunity for improvement • Consulted with the TB Elimination Program • Reviewed laboratory contamination rates • Developed new specimen acceptance criteria • Another “Dear Colleague” letter sent to MSPHL customers outlining the new specimen acceptance criteria • Letter outlined benefits of changes
Successes/Accomplishments • Currently receiving 58% of clinical specimens within 24-hours after collection • Increase of 25% since start of QI Project • Some LPHA’s developed individual QI goal and using the laboratory quarterly report as a measurement tool • Fostered closer relationships with submitters • Reduction of overall TB laboratory contamination rate
National Standard, 67% 58% 54% 40% 33%
2.76% 1.15%
National Comparison • CDC Aggregate Data through 2015* • 12 out of 57 laboratories are receiving at least 67% of specimens within 24-hours • National average is 48% • 31 out of 57 laboratories are above the 48% *CDC. Fourth Edition of the Tuberculosis Laboratory Aggregate Report, Atlanta, Georgia: U.S. Department of Health and Human Services, CDC; 2017
Prompting CQI Empowering staff to develop local level solutions!