Download
1 / 21
360 likes | 719 Views
THE SIX SIGMA APPROACH TO REDUCE THE PRODUCT DAMAGES IN THE WAREHOUSE. Assist.Prof.Dr.Nihal ERGİNEL Prof.Dr.Nimetullah BURNAK 2003. Introduction. The most common complaint of end customers about the defects is the product damages.

E N D
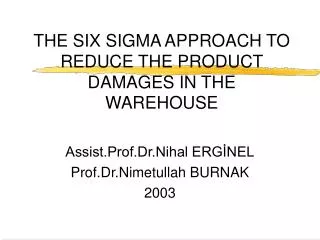
THE SIX SIGMA APPROACH TO REDUCE THE PRODUCT DAMAGES IN THE WAREHOUSE Assist.Prof.Dr.Nihal ERGİNEL Prof.Dr.Nimetullah BURNAK 2003
Introduction • The most common complaint of end customers about the defects is the product damages. • This damage can occur to the warehouse in which the products are packaged, stored, and shipped. • Six sigma methodology is applied to eliminate the complaints about the product damages.
Steps • We set process map, and cause – effect diagram to find the effective factors. • Their priorities are assigned via Chi-Square test and cause – effect matrix. • It is decided that the product damages can occur in any one of the two phases. • The first phase is the packaging for which packaging materials and packaging method are considered. • The second phase is the transportation for which handling equipments are analyzed. • DOE is conducted separately for each of the phases, and the results are discussed.
Chi-Square test It is clear that Model A has significantly higher number of damages on front than the other models. Model-D has significantly lower number of damages on front than the other models. This main difference between the packaging types of model A and D is the distance between the product and the board. The mentioned distance is larger in model-D than in model-A.
DOE-1on the packaging materials and methods • The response is the area of the damage measured in mm2 by using caliper. Gage R&R study was conducted before DOE-1.
Anova Table for DOE-1 The residual analysis is performed, and it was seen that residuals were normal. The plot of residuals versus time shows that there is no any pattern. Also, there is no indication of inequality of the variances by the plot of residuals versus fitted values.
Interaction effect This interaction effect shows that response is robust for board type-2.
Pie chart • The sytrophor density can explain the 44%, • the distance between board and the product can explain 18%, • the interaction between distance and board type can explain 13%, • of the damaged area.
DOE-2 on the set up values of forklift which is transportation equipment The response is the severity of the damage.
The response : The attribute Gage R&R was made.
Anova for DOE-2 • There is no any interaction. Attachment pressure and angel are affected on the damage severity.
Residual analysis The residual analysis is performed, and it was seen that residuals were normal. The plot of residuals versus time shows that there is no any pattern. Also, there is no indication of inequality of the variances by the plot of residuals versus fitted values.
Pie Chart The attachment pressure and angel are the significantly main effects with 26% and 52%, respectively
Results • By using the results from DOE-1 the packaging method and the material used were redesigned. • The values of attachment pressure and the attachment angel should be controlled periodically according to DOE-2. • These improvements were implemented, and a significant reduction was observed at the ratio of damaged product.
Further Research • Since these researches just in warehouse, it may be extended to other points of the process map, and the ratio of damaged product can be reduced.