Download
1 / 42
420 likes | 840 Views
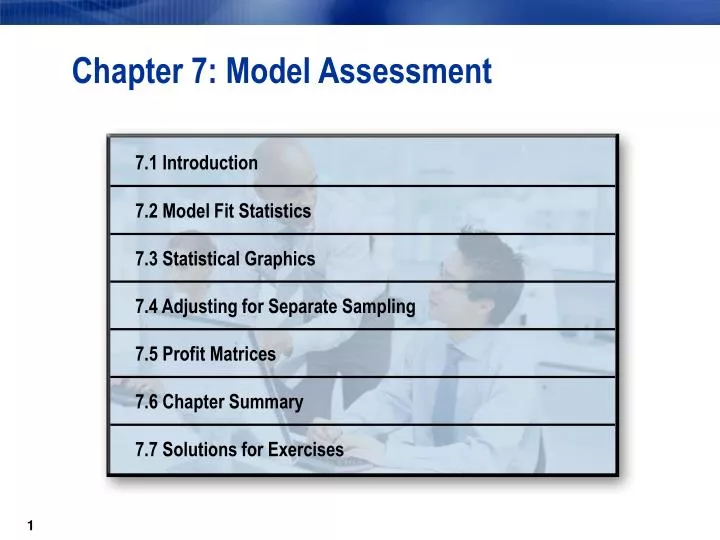
7. Chapter 7: Model Assessment. 7. Chapter 7: Model Assessment. Assessment Types. The Model Comparison tool provides. C. KS. Summary statistics Statistical graphics. ASE. 7. Chapter 7: Model Assessment. Summary Statistics Summary. Prediction Type. Statistic.

E N D
7 Chapter 7: Model Assessment
7 Chapter 7: Model Assessment
Assessment Types The Model Comparison tool provides C KS Summary statistics Statistical graphics ASE
7 Chapter 7: Model Assessment
Summary Statistics Summary Prediction Type Statistic Accuracy / Misclassification Profit / Loss KS-statistic Decisions ROC Index (concordance) Gini coefficient 1,2,3,… Rankings Average squared error SBC / Likelihood p≈E(Y) ^ Estimates
Summary Statistics Summary Prediction Type Statistic Accuracy / Misclassification Profit / Loss KS-statistic Decisions ROC Index (concordance) Gini coefficient 1,2,3,… Rankings Average squared error SBC / Likelihood p≈E(Y) ^ Estimates
Summary Statistics Summary Prediction Type Statistic Accuracy / Misclassification Profit / Loss KS-statistic Decisions ROC Index (concordance) Gini coefficient 1,2,3,… Rankings Average squared error SBC / Likelihood p≈E(Y) ^ Estimates
Comparing Models with Summary Statistics • This demonstration illustrates the use of the Model Comparison tool, which collects assessment information from attached modeling nodes and enables you to easily compare model performance measures.
7 Chapter 7: Model Assessment
Decisions Sensitivity charts Response rate charts Statistical Graphics Summary Prediction Type Statistic 1,2,3,… Rankings p≈E(Y) ^ Estimates ...
Apply model to validation data. Statistical Graphics – Prediction Ranks validation data ...
top 40% Prediction Ranks Select top n% cases. ...
Sensitivity-Based Plots Count fraction of primary outcome cases in selection. top 40% 1.0 sensitivity 0.0 ...
False Positive Fraction Count fraction of secondary outcome cases in selection. top 40% 1.0 sensitivity 0.0 0.0 1.0 false positive fraction (1-specificity) ...
ROC Chart Repeat for all selection fractions. 1.0 sensitivity 0.0 0.0 1.0 false positive fraction (1-specificity) ...
1.0 sensitivity 0.0 0.0 1.0 false positive fraction (1-specificity) ROC Index ROC Index (c-statistic) ...
1.0 0.5 0% 100% 40% percent selected (decile) Response Rate Charts top 40% Select top n% cases. ...
Cumulative Gain top 40% Count fraction of cases in selection with primary outcome. 1.0 cumulative gain 0.5 0% 100% 40% percent selected (decile) ...
Cumulative Gains Chart Repeat for all selection fractions. 1.0 cumulative gain 0.5 0% 100% percent selected (decile) ...
Comparing Models with Statistical Graphics • This demonstration illustrates the use of statistical graphics to compare models.
Adjusting for Separate Sampling • This demonstration illustrates how to adjust for separate sampling in SAS Enterprise Miner.
7 Chapter 7: Model Assessment
Outcome Overrepresentation The sample size is determined not by the total number of cases but by the number of cases in least common outcome (usually primary). ...
Separate Sampling Cases are sampled separately from each outcome. Example: • sample all primary cases • match each primary case by one or more secondary cases ...
Separate Sampling Benefit • Similar predictive power with smaller case count
Separate Sampling Consequences • Must adjust assessment statistics and graphics • Must adjust prediction estimates for bias
Adjusting for Separate Sampling (continued) • This demonstration illustrates how to adjust for separate sampling in SAS Enterprise Miner.
Creating a Profit Matrix • This demonstration illustrates how to create a profit matrix.
7 Chapter 7: Model Assessment
Profit Matrices solicit ignore 14.86 0 primary outcome -0.68 0 secondary outcome 0 profit distribution for solicit decision
Profit Matrices solicit ignore 14.86 0 primary outcome -0.68 0 secondary outcome 0 profit distribution for solicit decision
choose the larger ^ ^ Expected Profit Solicit = 14.86p1 – 0.68p0 Expected ProfitIgnore = 0 Decision Expected Profits solicit ignore 14.86 0 primary outcome -0.68 0 secondary outcome 0 ...
Decision Threshold solicit ignore 14.86 0 primary outcome -0.68 0 secondary outcome 0 decision threshold ^ p1 ≥ 0.68 / 15.54 Solicit ^ p1 < 0.68 / 15.54 Ignore
Average Profit solicit ignore 14.86 0 primary outcome -0.68 0 secondary outcome 0 average profit Average profit = (14.86NPS– 0.68 NSS ) / N NPS = # solicited primary outcome cases NSS = # solicited secondary outcome cases N= total number of assessment cases
Evaluating Model Profit • This demonstration illustrates viewing the consequences of incorporating a profit matrix.
Viewing Additional Assessments • This demonstration illustrates several other assessments of possible interest.
Optimizing with Profit (Optional) • This demonstration illustrates optimizing your model strictly on profit.
Exercise 1 • This exercise reinforces the concepts discussed previously.
7 Chapter 7: Model Assessment
Assessment Tools Review Compare model summary statistics and statistical graphics. Model Comparison Create decision data; add prior probabilities and profit matrices. Data Source Tune models with average squared error or appropriate profit matrix. Modeling Tools
Assessment Tools Review Obtain means and other statistics on data source variables. StatExplore
7 Chapter 7: Model Assessment