Download
1 / 27
280 likes | 407 Views
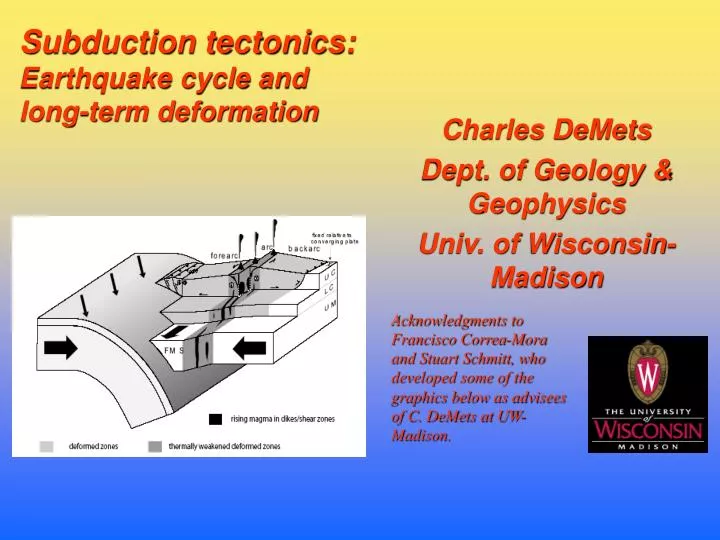
Subduction tectonics: Earthquake cycle and long-term deformation. Charles DeMets Dept. of Geology & Geophysics Univ. of Wisconsin-Madison. Acknowledgments to Francisco Correa-Mora and Stuart Schmitt, who developed some of the graphics below as advisees of C. DeMets at UW-Madison.

E N D
Subduction tectonics:Earthquake cycle and long-term deformation Charles DeMets Dept. of Geology & Geophysics Univ. of Wisconsin-Madison Acknowledgments to Francisco Correa-Mora and Stuart Schmitt, who developed some of the graphics below as advisees of C. DeMets at UW-Madison.
Presentation goal and outline Goal: Develop useful spatial and temporal frameworks for students to understand short-term and long-term deformation related to subduction Outline: • 2-D & 3-D spatial models for shallow subduction • Describe tectonic processes in subduction zones • Characterize subduction earthquake cycle • Categorize types of long-term deformation Note to participants: The majority of this presentation focuses on short-term processes that influence subduction zone tectonics (earthquake cycle). The latter third or so deals with long-term deformation, but uses GPS measurements (short-term once again!) to reveal one example of long-term upper plate deformation.
Conceptual model – 2D • Major components of the “system” • Upper plate (free to move in any direction - shown as fixed above) • Subducting plate – moves downward into mantle • Subduction interface – contact zone between upper and subducting plates. Frictional “surface” along which thrust earthquakes occur. Interface is subdivided into free-slip, seismogenic, and transitional zones. These are differentiated by their respective frictional properties.
3-D spatial model – layer properties • Upper layers – accumulate and release strain elastically • Lower layers – respond to stress “jump” via protracted viscous flow. Subduction interface
2D model – Earthquake cycle processes – Seismogenic zone Zone of interseismic locking • Seismogenic zone is locked by friction during long inter-earthquake periods (decades to centuries) – no motion between upper and subducting plates. Crust accumulates this “deficit” in slip elastically. Unrelieved slip accumulates at rates of mm to tens of mm per year. • Earthquake eventually ruptures seismogenic zone and recovers most or all of the interseismic slip deficit – meters of slip occur in just seconds to tens of seconds
2D model (continued) – After an earthquake Triggered by earthquake • Earthquakes “trigger” three transient processes in the crust and mantle. • Fault afterslip – a logarithmically decaying dynamic frictional response DOWNDIP from the seismogenic zone – manifested at surface as log-decay elastic response. Can equal 50-100% of the coseismic elastic deformation! Requires weeks to years to decay away. • Viscoelastic flow – coseismic stress jump in the viscoelastic lower crust and upper mantle triggers protracted FLOW in these regions, measured at surface as exponentially-decaying deformation. Continues for decades after large events. • Poroelastic deformation – coseismic volumetric changes in crust alters pore volumes and forces fluid flow, which in turn causes measurable surface deformation. Weeks to months.
Spatio-temporal model for subduction earthquake cycleUpper diagram shows movement of a hypothetical GPS site through the seismic cycle. - Interseismic – superposition of steady elastic strain accumulation across locked seismogenic zone due to steady plate convergence and occasional short-duration aseismic strain release across frictionally-transitional zone downdip from locked region. Free slip areas contribute nothing to surface deformation - Coseismic – Rapid opposite-direction release of accumulated elastic strain with slip dominantly along seismogenic zone - Postseismic – Superposition of triggered afterslip in transitional region and viscoelastic flow in mantle wedge and lower crust and poroelastic response in fluid-bearing regions of crust. Decays through time back to steady strain accumulation.
Continuous GPS along Mexican Pacific coast illustrates different phases of the seismic cycle Conceptual model Oaxaca CGPS Jalisco CGPS
Dense GPS network samples seismic cycle deformation in southern Mexico The next 5 slides show our imaging of the spatial relationship between interseismic locking and transient strain beneath Mexico from Cocos plate subduction. Ph.D. research of F. Correa-Mora advised by C. DeMets
Shallow regions of most subduction interfaces are characterized by occurrence of large shallow-dipping thrust earthquakes that define the seismogenic zone.
3-D modeling of a subduction zone permits different material properties to be assigned to different layers and zones, e.g. oceanic crust is “stiffer” than continental crust and hence has a diminished elastic response. Here, a dense 3-D mesh simulates the geometry of the Middle America subduction zone in the study area of southern Mexico.
Continuous and annual measurements of ~30 bedrock geodetic pins in the region with GPS are used to establish their motions through time. In the following two slides, I show results from inverting these GPS motions to estimate the location and magnitude of frictional locking along the subduction interface. continuous site example ‘01-’07 velocity field
Left – (A) location and magnitude of TRANSIENT slip in 2004. White dashed lines indicate areas of earthquake rupture in 1968 and 1978 mega-thrust earthquakes (defines seismogenic zone). (B) Location and magnitude of INTER-SEISMIC frictional LOCKING. Note that LOCKING occurs across seismogenic AND downdip zones (C) Slip magnitude and location during 2006 transient event. Note similarity to 2004 result!
Inversion of GPS site motions during a transient slip event in 2004 to define location and magnitude of the transient slipfrom Brudzinski et al. (2006) GJINote that slip is DEEP – well downdip from the seismogenic zone.Reinforces results from previous slide.
Synoposis of seismic cycle (short-term) deformation • Period of steady interseismic strain accumulation that ends with major thrust earthquake also includes occasional aseismic releases of elastic strain that has accumulated downdip from seismogenic zone. • Earthquakes trigger three post-seismic responses. Separating the three decaying processes (afterslip, viscoelastic flow, and poroelastic deformation) from each others is a “challenging” modeling exercise and is frequently non-unique.
What about long-term deformation ? Thus far, we have focused largely on elastic and thus recoverable deformation, which leaves little or no long-term permanent record. But UPPER plates clearly deform in a permanent manner (faulting, folding, uplift, subsidence) inboard from subduction zones. Geologists are more frequently interested in the long-term deformation record, as I imagine many of you may be…..
Let’s quickly review the three end-member types of upper-plate deformation and their causes…. • Upper plate shortening (mountain building) - Possible causes: Rapid trenchward motion of upper plate, overrides subducting plate, associated with shallow subduction, deformation far inboard from trench. Possible other cause – collision of seamount, oceanic plateau, or continental fragment traveling on subducting plate with the trench. • Upper plate extension (back-arc spreading) – Possible cause: Upper plate motion AWAY from trench induces upper plate extension. Possibly trench roll-back, but any lateral motion of a subducting slab must PUSH a great deal of mantle out of its path. Is roll-back possible? • Coast-parallel sliver transport – Possible cause: Oblique subduction and partitioning of obliquity into trench-normal subduction and trench-parallel upper-plate shear. Other cause – coastwise lateral escape from collision zone between a buoyant subducting feature with trench/upper plate. Let’s focus on the third of these, which is relevant to parts of the Middle America trench…..
Tectonic settingof Nicaragua/El Salvador segment of Middle America subduction zone. - oblique subduction - strain partitioning yields sinistral trench-parallel forearc shear - Basin and Range-like extension in Honduras, Guatemala, El Salvador - strike-slip tectonics along Motagua-Polochic faults (CA-NA plate boundary)
2000-2005 GPS velocity field – CA plate fixed.(1) cent/eastern Hond/Nic sites are on CA interior. (2) forearc slip obvious, (3) E-W stretching obvious(Proprietary results from ongoing M.S. research by D. Alvarado and M. Rodriguez – UW-Madison)
Dramatic difference in onshore character of GPS velocity fields along shallow-dipping Mexican segment of the MAT and steeply-dipping Central American MAT. Oaxaca El Salvador
Oaxaca segmentmoderate to strong frictional coupling (~75%)inferred from measured site motions High EQ hazardSalvador segmentweak or zero frictional coupling inferred from measured GPS site motionsLow EQ hazard ? Prediction of fully coupled elastic model 50% coupling Trench-normal GPS site motions El Salvador/Honduras
Nicaraguan GPS sites also move parallel to coast – no inland component of motion - indicates weak coupling across subduction interface
Absence of subduction “overprint” on onshore velocities affords clear view of upper plate LONG-TERM deformation!
Conclusions: Long-term deformation • Deformation of upper plate is dictated in part by upper plate motion relative to the trench. The subducting plate and hence trench cannot migrate laterally with ease and thus stays in place no matter how upper plate moves. • Deformation also depends on geometry of trench (bends), buoyant oceanic or continental fragments that are being subducted (or not), and RELATIVE direction of upper and subducting plate convergence (obliquity). THE END: (A GPS appendix follows, but is provided for GPS novices)
2-slide GPS appendix for skeptics – proof of technique If one or more of you are unfamiliar with the application of GPS geodesy to crustal deformation research, the following two slides show results from processing 24-hour continuous GPS station data to high precision in order to measure changes through time in the absolute coordinates and height of the fixed GPS monument. Graphic 1 shows that the daily site coordinates show random scatter superimposed on linear motion (well behaved). Graphic 2 illustrates the remarkable velocity pattern defined by numerous GPS sites, representing a powerful proof of the concept that GPS can be used to map plate motions and other forms of crustal deformation
Using GPS tracking to monitor plate movements Technical background
GPS Site motions- Raw GPS processing done at UW-Madison- Continuous GPS station motions relative to ~mantle-fixed reference frame (above)- Motion around and toward best pole of rotation (left) Technical background