Download
1 / 26
260 likes | 444 Views
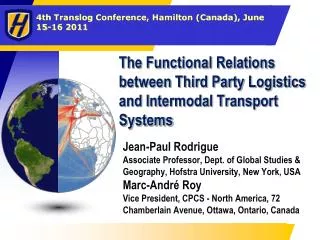
The Functional Relations between Third Party Logistics and Intermodal Transport Systems. Jean-Paul Rodrigue Associate Professor, Dept. of Global Studies & Geography, Hofstra University, New York, USA Marc-André Roy

E N D
The Functional Relations between Third Party Logistics and Intermodal Transport Systems Jean-Paul Rodrigue Associate Professor, Dept. of Global Studies & Geography, Hofstra University, New York, USA Marc-André Roy Vice President, CPCS - North America, 72 Chamberlain Avenue, Ottawa, Ontario, Canada
The Product as a Supply Chain… iPad 1 (2010) iPad 2 (2011) 3.1 lbs. 2.8 lbs. 25.4 cm 19.8 cm 20.3 cm 4.3 cm 5.1 cm
Layers to Logistics Services Actors Services Cargo owners Manufacturing, Retailing Transportation Carriers Logistics serviceproviders Service integration Logistics Supply chainmanagement Lead logistics providers& consultants Supply chain integration
3PL: An Attempt at a Definition A firm that adds value to the supply chains of beneficial cargo owners, directly or indirectly, by providing a range of logistics services beyond the mere carriage of goods. 3PLs control 40% of the global TEU in transit through maritime shipping
Main Core Competencies of Third Party Logistics Providers Product Transport
Getting Blurry: Services Offered by Third and Fourth Party Logistics Providers
Location of 3PLs in Canada by Number of Employees Reflective of the Canada’s commercial geography of gateways and corridors. Ontario: 50.2% of employees Source: base data from Dun & Bradstreet, primary NAICS code 488510
Location of 3PLs in Canada by Number of Headquarter Employees Reflective of the Canada’s urban hierarchy and cross-border intensity. Ontario: 64.2% of headquarter employees Source: base data from Dun & Bradstreet, primary NAICS code 488510
Asset and Non-Asset Issues • Asset Stigma • Perception that an asset-based firm will be pressured to route flows through its own assets. • Majority (85%) of 3PLs brand themselves as non-asset based(may lease facilities or use hybrid model). • Large 3PLs: • Greater share of asset-based firms. • Networks of assets. • Small / micro 3PLs: • More alliances (sharing of assets). • Smaller long-term commitments to assets and more focus on being agile.
Quebec – Windsor Corridor: Location of 3PL Firms and Value of Freight Transiting at Gateways Source: base data from Dun & Bradstreet, primary NAICS code 488510 The clustering of 3PLs around major ports of entry along the Quebec‐Windsor corridor is notable. Ambassador Bridge is largest Transit Point, but not largest cluster of 3PLs. Largest 3PL cluster around Pearson Intl. Airport.
Asia Pacific Gateways and Corridors: Location of 3PL Firms and Value of Freight Transiting at Gateways Clustering around Western Canadian cross-border ports of entry. Related to customs activities and represent a specialized and localized segment of the 3PL industry. Vancouver: Canada’s sole “all-centric” 3PLs cluster. Source: base data from Dun & Bradstreet, primary NAICS code 488510
High concentration of 3PLs along the “sweet spot”; Louisville –Pittsburg. Market-centric 3PL clusters around centroids of optimal regional accessibility or intermediary locations along corridors of freight circulation (e.g. Allentown, PA) Source: base data from Dun & Bradstreet, primary NAICS code 488510
Services and Commodities • Size matters • Degree of supply chain integration tends to increase proportionally to firm size. • Largest firms most likely to offer a variety of service: • Large 3PLs handle 90% of commodity/sector categories on average. • Focus on economic sectors characterized by economies of scale (mass market) along with stable demand. • Some kinds of cargo (e.g. project cargo) are highly localized; dominance of small / micros. • Large players use a broad network, while smaller firms use a patchwork quilt of alliances.
Vertical and Horizontal Integration in 3PLs Large Medium Level of Services Offered (Vertical integration) Micro & Small Commodities Served (Horizontal integration)
Trade Focus • Import bias • General focus on 3PL services to imports, rather than exports. • Importers also include pure freight forwarders who are generally indifferent with respect to asset placement. • Micros were significantly more inclined to be import-focused. • Exports of raw materials: • Tend to lean on economies of scale, move in large loads, have a limited number of buyers and few value-added activities involved. • The expertise of 3PLs is much less required and the tasks are assumed by the carrier.
Main Export-Oriented Regions and Shipping Routes Servicing North America: A Shift to Near-Sourcing? Pacific Asia / American East Coast Intermodal (60%) Western Canada (5%) All Water (40%) Pacific Northwest (20%) Via Suez (5%) Pacific Southwest (75%) Via Panama (95%) Mexico(?%)
The Big Port Squeeze: Largest Available Containership, 1970-2013 (in TEUs) “Triple E” Class(18,000 TEU) E “Emma” Class(12,500 TEU) S “Sovereign” Class(8,000 TEU) R “Regina” Class(6,000 TEU) L “Lica” Class(3,400 TEU)
Comparative Advantages in Supply Chain Preferences: A Complex Balancing Act Shipping Rate from Shanghai for a 40 Foot Container, Mid 2010 Vancouver Montreal $2,300 $2,110 $4,040 $3,950 Time New York $3,700 $1,830 Los Angeles Costs $2,620 $1,400 Houston $3,510 $2,560 Inbound rates: function of distance Outbound rates: function of trade imbalances Reliability (?) Inbound Outbound $1,300 $2,100
The “Terminalization” of Logistics Terminalization
CRB Index (CCI), Monthly Close, 1970-2011 Paradigm shift in input costs… Reaping the consequences of monetary policy.
West Texas Intermediate, Monthly Nominal Spot Oil Price (1970-2011) This is also going to propagate along supply chains. Response from shipping companies: slow steaming
Conclusion (Take 2): 3PLs as the Emerging Supply Chain Management Paradigm