Download
1 / 35
370 likes | 551 Views
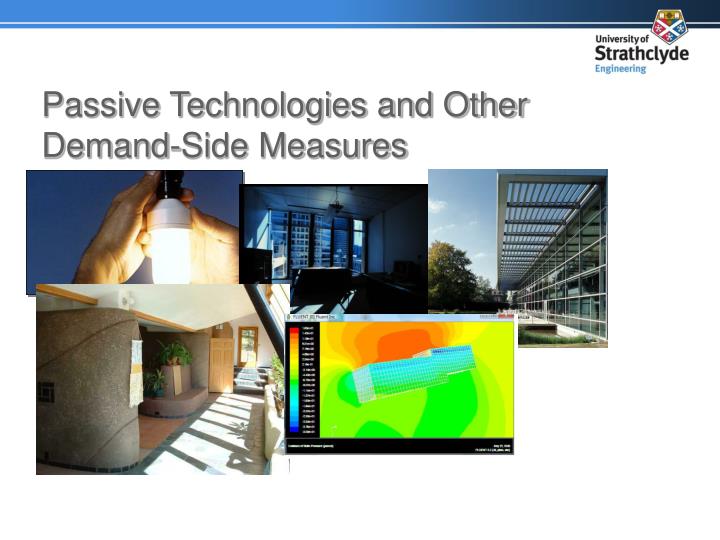
Passive Technologies and Other Demand-Side Measures. Overview. energy consumption in buildings passive demand reduction examples insulation thermal mass natural ventilation nat. vent alternatives demand management and “demand-shifting”. Energy Required (Revisited). space heating

E N D
Overview • energy consumption in buildings • passive demand reduction examples • insulation • thermal mass • natural ventilation • nat. vent alternatives • demand management and “demand-shifting”
Energy Required (Revisited) • space heating • hot water • electricity • lighting • appliances • cooling • … also for space heating and hot water demand in a typical commercial building
Energy Required (Revisited) • “Typical” average energy consumptions for dwellings: • Source: Domestic Energy Fact File
Energy Required (Revisited) • “Typical” average energy consumptions for offices: • Source: ECGO 19
Illustration: Domestic Sector • Using a simple housing stock model the C emissions for the domestic sector are calculated for the current electricity supply mix and post 2020 mix (0% nuclear, 40% RE, 60% fossil fuel) for the following scenarios: • continuing current trends (increasing heat and electricity demand) • 30% reduction in heat demand • 30% reduction in heat and electricity demand • The desired reduction for carbon from the domestic sector is also shown
Example: Domestic Sector • Only through reducing domestic heat and power demand do we achieve any carbon savings • Even with 40% renewables but with increasing demand carbon emissions are still greater in 2020!
Energy Required Revisited • fortunately given the poor energy performance of most buildings in the UK the scope for energy savings is huge • in this lecture we will cover passive (design-driven) energy saving measures • … and aspects of load management
Fabric Improvements • improving the building fabric reduces the thermal exchanges to/from the environment e.g.: • heat loss from inside to outside • heat gain from outside to inside • this can be achieved in a number of ways • adding/improving wall insulation • replacing old glazing systems (also reduced unwanted infiltration) • improving air tightness (+ MV with heat exchange) • potential for 80%* reductions in heating-related energy loads • * Olivier D, 2001, Building in Ignorance: Demolishing Complacency - Improving the Energy Performance of 21st Century Homes, report published by the Association for the Conservation of Energy.
Fabric Improvements • Source: EC
Fabric Improvements • however there are potential pitfalls: • increased risk of overheating (high internal loads) • reduced air quality (reduced infiltration) • overall fabric improvements are one of the most cost-effective ways to reduce energy consumption and carbon emissions – particularly in older buildings/retrofit projects • Source: EST
Thermal Mass • the use of exposed thermal mass is typically employed in buildings (or spaces) likely to experience overheating: • sunspaces • areas of high occupancy • areas with high equipment loads • thermal mass acts like a sponge – absorbing surplus heat during the day and releasing the heat during the evening • however to work effectively the release of heat in the evenings needs to be encouraged through flushing of the air inside the building
Thermal Mass daytime: Te > Tm evening: Te < Tm ventilation air exposed mass exposed mass insulation insulation
Thermal Mass start of night flush heat release from mass end of night flush heat gain by mass
Thermal Mass • useful in preventing overheating however: • slow response to plant input • more difficult to accurately control internal conditions (plant pre-heat required) • risk of under-heating on colder mornings • surface condensation risk
Thermal Mass • thermally massive buildings are highly dynamic thermal systems • typically rely on thermal modelling to gauge the effects on performance • … particularly when also dealing with night flush, etc.
Thermal Mass • testing thermal mass + night flush strategy with ESP-r
Natural Ventilation • ventilation type in most smaller UK buildings • driven by wind pressure and density variations • single sided ventilation (density driven) • stack ventilation (density driven) • cross flow ventilation (wind driven)
Natural Ventilation • driving force will usually be a combination of wind + density (buoyancy) forces • influenced by: • wind direction • wind speed • ventilation opening location • interior/exterior temp. difference • internal gains • building geometry • results in highly variable flow (magnitude and direction)
the reality! the drawing … Natural Ventilation
Natural Ventilation • given the range of driving forces and general complexity of natural ventilation (strongly coupled with temperatures) computer modelling is often used to assess natural ventilation schemes • gives an indication of the variability of flow and the influence on internal temperatures, comfort and air quality
Nat. Vent Alternatives • if more control is required over the air flow in a building an alternative is to employ mechanical ventilation with heat recovery (MVHR) • the warm exhaust air is passed through a heat exchanger to pre-heat incoming ventilation air, reducing the overall building heating load • air flow rate is controlled by a fan – more controllable than nat. ventilation but fan consumes electricity • In both nat. vent. and MVHR building must be tightly sealed to minimise unwanted infiltration
de –pressurised interior Nat. Vent Alternatives • another alternative to natural ventilation is so-called “dynamic insulation” • ventilation is drawn through porous insulation in the external wall cavity • recovers heat that would otherwise be conducted through the wall to the environment • interior of the building must be slightly de-pressurised in relation to the outside • can significantly reduce the “U-value of the wall”
Demand Shifting load (GW) • demand shifting is not the same as demand reduction – bit both have a role to play in the low-energy buildings of the future • both can be considered as elements of “demand management” • with demand shifting we move appropriate loads in time for an environmental and/or an economic benefit • this is related to time-varying cost and carbon content of electricity • shifting can also be used to maximise the benefit of local low carbon technologies cost £ CO2 g/kWh
Demand Shifting • different power generation “mixes” means different electricity carbon intensity during the day
Demand Shifting • with demand shifting we make use of “opportune” loads to move peak demand out of peak cost or peak CO2 intensity periods • note this does not reduce demand – only changes the demand profile CO2 g or £/kWh
Demand Shifting • opportune loads are loads that can be moved in time without inconveniencing the user or causing adverse effects
Demand Shifting • finally we can also use demand shifting to better match local loads to local energy supplies • e.g. with a PV system moving loads to the middle of the day when generation is at a maximum • this can also be done dynamically – with loads operating when power is available - dynamic supply-demand matching • this can also be done statically at the beginning of the design process, reducing and levelling loads as far as possible and then selecting appropriate renewable sources • tools such as Merit (UK) and Homer (US) have emerged to assist in this process