Download
1 / 23
230 likes | 397 Views
Information and background on climate change Gustav Strandberg Rossby Centre, SMHI, Sweden 090401. Climate has always been changing. 600 500 400 300 200 100 0. Years*1000 before 2005. Carbon dioxide. ”Temperature ”. Interglacials.

E N D
Information and background on climate change Gustav Strandberg Rossby Centre, SMHI, Sweden 090401
Climate has always been changing 600 500 400 300 200 100 0 Years*1000 before 2005 Carbon dioxide ”Temperature” Interglacials (IPCC, 2007)
Global emissions of carbon dioxide increases the amount in the atmosphere
Temperature change – global and in Sweden (compared with the years 1961-1990)
The concentrationof CO2 in the atmosphere hasreached a record high relative to more than thepast half-million years, and has done so at an exceptionally fast rate. Current global temperatures are warmer than they have ever been during at least the past five centuries, probably even for more than a millennium. If warming continues unabated, the resulting climate change within this century wouldbe extremely unusual in geological terms. IPCC, 2007
Radiation components: change 1750 to 2000 (IPCC, 2007)
The present climate change can not be explained without anthropogenic effects (IPCC, 2001)
2008 386 ppmv 2007 10 Gt C / yr Given certain CO2-emissions what will future concentrations be?
Emission scenario + global climate model + (regional climate model) + time period = climate scenario (or climate projection) A climate scenario is a combination of several assumptions.
What we don’t know. Future amounts of green-house gases. What we can’t describe. Different climate models represents the climate system differently and with different quality. Natural variability. A climate model can not exactly reproduce the climate in one specific year. Uncertainties in the i scenario
Climate models does not reproduce the real weather in a specific point at a certain time. A good quality climate model gives a probable realisation of the weather, with realistic statistical properties. Scenarios are not forecasts
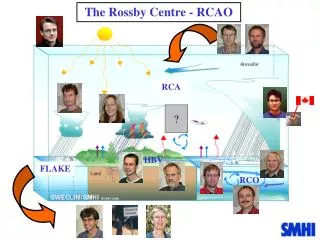
Climate models Climate model: Three dimensional representation of the atmosphere coupled to the land surface and oceans (biosphere, carbon cycle, atmosphere chemistry) Global resolution 100 – 400 km Regional resolution 10 – 50 km (NCAR)
Regional Global Resolution in different models
How good is a climate model? Observations, models, model mean
How can a climate model say something about what happens in 100 years, when a weather prediction can not be longer than one week? The atmosphere is like a non-linear equation: X=A*X – X2
Climate change is different in different regions • Some regions will be more heated than others °C per +1°C in global average temp. • Precipitation increases in some areas and decreases in others % per +1°C in global average temp.
Future global warming – despite uncertainties there are clear signals
Climate change presentation – Example Sweden http://www.smhi.se/cmp/jsp/polopoly.jsp?d=8785&l=sv
The analysis Two scenarios: SRES A2, SRES B2 Global model: ECHAM4/OPYC3 Regional model: RCA3 Sweden is divided into regions. All grid boxes that fall into a region are collected. For each region time series and statistics are calculated.
Results Time series – annual and seasonal Annual A2 B2 Seasonal Winter Spring Summer Autumn A2 B2
Results Frequency distributions 1961-1990, 2071-2100 Winter Summer A2 B2