
Monitoring Ground Beetles in Forests Affected by European Buckthorn Removal
This study investigates the impact of removing European buckthorn (Rhamnus cathartica) on ground beetle (Coleoptera: Carabidae) communities in a floodplain forest in northwestern Iowa. Findings reveal that while overall beetle abundance and richness showed no significant differences between control and treatment plots, variations were noted among treatment plots based on initial buckthorn densities. Some rare beetle species were found exclusively in low-density buckthorn areas, emphasizing the complex interplay between invasive species management and forest community structure.

Monitoring Ground Beetles in Forests Affected by European Buckthorn Removal
E N D
Presentation Transcript
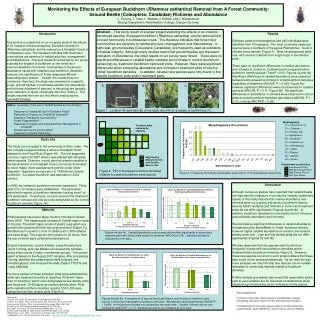
Monitoring the Effects of European Buckthorn (Rhamnus cathartica) Removal from A Forest Community: Ground Beetle (Coleoptera: Carabidae) Richness and Abundance L. Furlong, T. Tracy, L. Walters, J. Knibbe, and J. Nieuwenhuis Biology Department, Northwestern College, Orange City Iowa Abstract – This study is part of a larger project exploring the effects of an invasive introduced species, European buckthorn (Rhamnus cathartica), and its removal from a forest community in northwestern Iowa. The literature indicates that forest floor communities are sensitive to habitat structure, management, and disturbances. In particular, ground beetles (Coleoptera: Carabidae), are frequently used as indicators of habitat integrity. Although many studies report that ground beetles are important indicators of disturbance, the initial results of our survey were mixed. There were no significant differences in carabid beetle numbers and richness in control (buckthorn remaining) vs. treatment (buckthorn removed) plots. However, there were significant differences when comparing abundance and richness in treatment plots of varying “initial” buckthorn densities. In addition, several rare species were only found in low density buckthorn plots and/or treatment plots. Introduction This work is a component of our on-going study of the effects of an invasive introduced species, European buckthorn (Rhamnus cathartica), and its removal on a floodplain forest in northwestern Iowa. The literature indicates that forest floor communities are sensitive to habitat structure, management, and disturbances. Previous research conducted by our group explored the impacts of buckthorn on the forest floor macroinvertebrate community. Invertebrate richness and abundance varied with treatment and buckthorn densities; however, the significance of these responses differed depending upon season. Overall, the results were not conclusive, therefore, the study was narrowed to a specific group, ground beetles. In numerous studies, the abundance and richness (numbers of species) of this group are typically good indicators of larger community structure (Table I). The results reported here are our first efforts employing this narrowed strategy. Results Eighteen carabid morphospecies and 245 individuals were identified from 120 samples. The most commonly observed species were 2 members of the genus Pterostichus, found in virtually every sample (Figure 3). Most morphospecies were rare, with several collected from single traps in low density plots. There were no significant differences in carabid abundance and richness in control vs. treatment plots compared within buckthorn density groups (Ttest P >0.05, Figures 4a and 4b). Significant differences in carabid abundance were observed between plots grouped according to initial buckthorn densities regardless of treatment (ANOVA, P = 0.009, Figure 5a); however significant differences were not observed for carabid richness (ANOVA, P = 0.11, Figure 5b). No significant differences in abundance in richness were observed in control plots at varied buckthorn densities (abundance ANOVA, P = 0.16; richness ANOVA P = 0.84). Figure 1. Location (A) and view (B) of the study site with an example of a pitfall trap (C). A. B. C. Figure 1. Morphospecies Occurrence and Predominant Location Table I. Examples of the use of carabid beetles as bio-indicators. Response to Insecticide Use in Blueberry Fields1 Response to Organic vs. Traditional Vineyards2 Impacts of Transgenic Corn and Soy 3 Forest Fragmentation 4 Response to Organic and Integrated Pest Management in Orchards5 Ponderosa Pine Forest Condition6 Response to Gardent Mulching7 Morphospecies: Treatment plots indicated by stippling Study Site The study site is located in the community of Alton, Iowa. The site consists of approximately 4 acres of floodplain forest adjacent to the Floyd River (Figure 1A). The site supported corn/soy crops until 1967 when it was planted with tall grass prairie species. Overtime, woody plant succession resulted in the development of a floodplain forest community dominated by silver maple (Acer saccharinum) and box elder (Acer negundo). Vegetative surveys prior to 1998 did not include buckthorn. European buckthorn was abundant in 2003 surveys. In 2005, we initiated a buckthorn removal experiment. Thirty plots (20 x 20 meters) were established. The plots were paired with respect to buckthorn densities (varying from 0 to 235 plants/plot). In each pair, one plot received the treatment buckthorn removal and one plot was designated as the control (buckthorn remains, Figure 1B). High Density Medium Density Low Density Source Tree Predominant Location Key: Low Density Plot(s) Medium Density Plot(s) High Density Plots(s) Plot Type Varied Figure 2. Plot of European buckthorn densities (relative to putative buckthorn seed source). Figure 3. Frequency (# of plots) and location (type of plot) of morphospecies occurrence. Discussion Although numerous studies have reported that carabid beetle are important bio-indicators of community integrity, preliminary results of this study indicate that relative abundance and richness were not a strong indicators of buckthorn density. Ground beetle numbers and richness in control and treatment plots did not differ significantly (Figures 4a and 4b). In addition, buckthorn densities in control plots did not influence ground beetle abundance and richness. We did observe significant differences in carabid abundance in treatment plots that differed in “initial” buckthorn density, however higher carabid abundance occurred in the medium density plots only - high and low density plots did not differ significantly (Figures 5a and 5b). We also observed that rare species were found more frequently in plots with low buckthorn densities and/or treatment plots (buckthorn removed, Figure 3). However, these rare species occurred in such small numbers that these data could not be analyzed statistically. As we work through more samples, we may find that rare species can be reliable indicators of community impacts related to buckthorn densities. Further sample processing may reveal that seasonality and/or year to year variation are an important considerations when employing ground beetles as bio-indicators in this system. Methods Pitfall samples have been taken monthly from April-October since 2006. The trapping grid consists of 4 pitfall traps in each of 30 plots. The pitfall traps consist of plastic cups which are buried in the ground with their lips at ground level (Figure 1C). We filled each cup with 2-3 cm of “death juice” (70% ethanol and liquid soap). The cups are left in place for 24 hours, then the cup contents were collected and preserved. Student researchers (Jackie Knibbe, Jesse Nieuwenhuis, Jenna Furlong, and Lisa Walters) processed the samples, giving initial counts of major invertebrate groups. The current report is based on the August 2007 samples. After processing, Furlong identified the carabid specimens to genus and “morphospecies” and analyzed the data (Type-2 TTESTs and 1-way ANOVAs). For the purposes of these analyses, plots were subdivided by initial (pre-treatment) buckthorn densities. Plots with fewer than 10 buckthorn plants were designated as low density plots and those with 19-48 plants as medium density plots. Plots with original buckthorn densities ranging 124 to 235 were categorized as high density plots (Figure 2). Figures 4a and 4b. Carabid abundance and richness did not differ significantly in control and treament plots with varied initial buckthorn densities (ANOVA p>0.05). Standard deviations indicated by error bars. B A A Acknowledgements: Funding for this project was provided by a Northwestern College Scholarship Grant and a grant from the Iowa Science Foundation. Invaluable help for this project was provided by student researchers (Jackie Knibbe, Jesse Niewenhuis, Jenna Furlong, and Lisa Walters). References: 1French, et al. 2004. Environmental Entomology 33(3): 554-563 2Goulet, et al. 2005. Annals of the Entomol. Soc. of America. 97 (6):1263-1272 3Jennings and Tallamy. 2006. Environmental Entomology 35(6):1550-1560 4O’Neal, et al. 2005. Environmental Entomology 34 (2): 378-384 5Ve Labrie, et al. 2003. Environmental Entomology 32(1): 123-132 6Villa-Castillo and Wagner. 2002. Environmental Entomology 31(2):242-252 7Wiedenmann, et al. 2004. J. of the Kansas Entomol. Soc. 77(2): 99-109 Carbid photos from: The Ground Beetles of Canada. http://www.cbif.gc.ca/spp_pages/carabids/phps/index_e.php Figures 5a and 5b. A comparison of ground beetle abundance and richness in treatment plots varying in initial (pre-manipulation) buckthorn densities. Abundances varied significantly (ANOVA P = 0.009). Non-significant subsets are indicated by the same letter. Carabid richness did not vary signficantly (ANOVA P = 0.11) Standard deviations are indicated as error bars.


