Download
1 / 26
270 likes | 451 Views
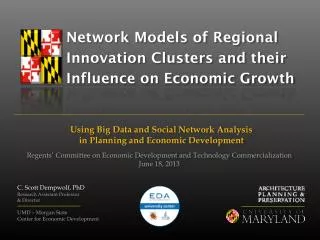
Network Models of Regional Innovation Clusters and their Influence on Economic Growth. Using Big Data and Social Network Analysis in Planning and Economic Development. Regents’ Committee on Economic Development and Technology Commercialization June 18, 2013. C. Scott Dempwolf, PhD

E N D
Network Models of Regional Innovation Clusters and their Influence on Economic Growth Using Big Data and Social Network Analysis in Planning and Economic Development Regents’ Committee on Economic Development and Technology Commercialization June 18, 2013 C. Scott Dempwolf, PhD Research Assistant Professor & Director UMD – Morgan State Center for Economic Development
Today’s Talk • Regional Innovation Clusters: Why current metrics don’t tell us what we need to know - and how to fix it • Innovation Networks & economic growth (dissertation) • Creating new tools and new metrics (current research) • Maryland – work in progress • Discussion: Potential University System applications http://www.terpconnect.umd.edu/~dempy/docs/md06182013b.pptx
Innovation Driven Growtha simple stylized model Product Improvement Innovation based Production Production Development Invention Production Employment Basic Research years Research Parks Incubators Economic Development Response Business Attraction Business Expansion Business Retention
Innovation Driven Growthhow do we measure it now? Product Improvement Innovation based Production Production Development Invention Production Employment Basic Research years ~ 5 years +/- First Employment Data Available Clusters defined by established Industries, not emerging technologies Research Parks Incubators Regional Cluster Analysis Business Attraction Business Expansion Business Retention Bottom Line Industry clusters -by whatever name- reflect the state of innovation about five years ago
Innovation Driven Growthgaining early actionable intelligence Product Improvement Innovation based Production Production Development Invention Production Employment Basic Research years ~ 5 years +/- First Employment Data Available Clusters defined by established Industries, not emerging technologies Research Parks This approach can shorten the lag between real-time innovation and actionable economic development intelligence by several years while also revealing rich talent pools, emerging technology trends, and specific E.D. targets Incubators A New Approach Business Attraction Business Expansion Innovation Network Analysis Business Retention NIH Awards NSF Awards NASA Awards Patents SBIR Awards State Investment Data ~ 4 years +/- Available Data Sets
Regional Innovation Clustersare Complex Systems Complex Systems: • involve many interconnected or interacting parts • exhibit emergence - behaviors that cannot be understood or predicted by looking at the components of the system alone • Emergence is based on a few simple rules of interaction • Networks are ideal for modeling complex systems Regional innovation clusters are geographically concentrated but also have important ties to distant actors Georgia Innovation Network 2008 – 2010 Locations of selected actors
Networks & Network Models Networks made up of nodes and links (ties, edges) Nodes are actors, agents or objects People Organizations Agencies Places * documents Links are the relationships that connect the nodes
Analyzing Regional Innovation Clusters Extract relationships from patent and research grant data - about 7M records Use social network analysis (SNA) to analyze and visualize network structure Theoretical grounding in sociology and science of complexity Behavior of the core network guides behavior of whole network Clustering based on intensity of relationships This reveals emerging technologies - what people and firms are working on – and specialized talent pools Battelle Innovation Network 2005 – 2010 Created with NodeXL
Dissertation Conclusions PA Innovation Clusters Westinghouse cluster, Pittsburgh PA Network graphics created with NodeXL Innovation networks are (or could be) drivers of economic development in tier 2 manufacturing regions. Innovation is more global and more interconnected than previously thought Network structure influences manufacturing employment growth within about 3 years of patent application (more for med & pharma) Economic development strategies that enhance innovation networks may be a cost-effective alternative to current capital intensive strategies.
Great Lakes Regional Innovation & Manufacturing Clusters (all clusters) This example looks at US – Canada cross-border innovation around the great lakes. How do we quickly find, simplify and understand the driving innovation clusters in this region?
Great Lakes Regional Innovation & Manufacturing Clusters (core)
Potential USM Applications Visualizing a Research Portfolio Well suited for integrating and managing research across multiple institutions via open networks rather than institutional structure Offers both a big picture and details of technology commercialization areas and opportunities What we need: Modest additional resources to create data sets around Maryland institutions and venture capital networks Georgia Tech Innovation Network 2008 - 2010 (2 steps) Created with NodeXL http://www.terpconnect.umd.edu/~dempy/docs/md06182013b.pptx
Changes in the Maryland Network Why do we see changes? What does it mean? If data issue or anomaly Nothing If type of research or recession influence – understanding of those dynamics If structural Diminished benefits of agglomeration Limited leverage of R&D Economic Development more difficult • Still work in progress • Data issue? • Specific to type of research? • Lagged influence of recession? • Could be…??? • May represent structural changes
What’s Next? Current Research Future Possibilities Workforce Development applications Integration of additional data sources Sensitivity analysis and predictive models Other applications? Pending proposal with DLLR / DBED • Database and web interface development • Field testing & research • Urban planning and economic dev. Apps • Document and teach methods • Funded by EDA and UMD Office of Research
New Jersey Solar PV Cluster 2008 - 2010 Grid layout in NodeXL Fruchterman-Reingold layout In NodeXL
Maryland Innovation Clusters 2008 - 2010 Maryland Innovation Network 2008 – 2010 Created with NodeXL Baltimore Innovation Network 2008 – 2010 Created with NodeXL
University of MarylandHuman Computer Interaction LabInfluence on NSF Network 2000 - 2011