Download
1 / 31
320 likes | 503 Views
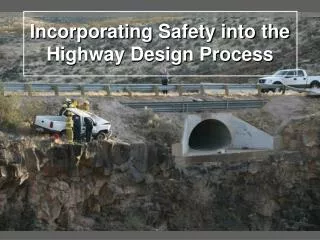
Incorporating Safety into the Highway Design Process. What is Meant by “Safe”?. Is This Road Safe?. What is Meant by “Safety”?. Is This Road Safe? Is a “Yes” or “No” answer sufficient? Would your answer change if you were told... The road averages 1 crash in 10 years? or...

E N D
What is Meant by “Safe”? • Is This Road Safe?
What is Meant by “Safety”? • Is This Road Safe? • Is a “Yes” or “No” answer sufficient? • Would your answer change if you were told... • The road averages 1 crash in 10 years? or... • The road averages 100 crashes in 10 years?
Kinds of Safety • Nominal Safety • A road that conforms to the agency’s policy, guidelines, and warrants is “nominally” safe • A road either is, or is not, nominally safe • Substantive Safety • The performance of a roadway, as defined by its “expected” crash frequency (i.e., long run average) • Substantive safety is a continuous variable • Useful to compare one site with “typical” site
Kinds of Safety • Safety Comparison (NCHRP Report 480)
Safety-Conscious Design • AASHTO Guidance • “Consistent adherence to minimum [design criteria] values is not advisable” • “Minimum design criteria may not ensure adequate levels of safety in all situations” • “The challenge to the designer is to achieve the highest level of safety within the physical and financial constraints of a project” • Highway Safety Design and Operations Guide, 1997
Highway Crashes • Contributing Factors • Driver • Age, gender, skill, fatigue level, alcohol, etc. • Vehicle • Type, age, maintenance, etc. • Environment • Light conditions, weather, precipitation, fog, etc. • Roadway • Geometric design, traffic control, etc. • Focus of current research • Geometric design of the roadway
Quantifying Safety • Safety Prediction Model • C = base crash rate × volume × length × AMF • Accident Modification Factor (AMF) • AMF used to estimate change in crashes due to a change in geometry (AMF = Cwith/Cwithout) • Example: • AMFadd bay = 0.70 • Cno bay = 10 crash/yr • Cwith bay = Cno bay× AMFadd bay = 7 crashes/yr • Crash reduction factor (CRF) = 1 - AMF
Crash Data Research focus • Existing Crash Databases • Texas Department of Public Safety (DPS) • Local databases • Severity Scale • K: Fatal • A: Incapacitating injury • B: Non-incapacitating injury • C: Possible injury • PDO: property damage only • Reporting Threshold • $1000, informally varies among agencies
Crash Data Variability • Examination of Crash History • Annual crash counts: 2, 3, 1, 1, 7, 5, 2... • Count in any one year is effectively random • Variability year to year is LARGE • So large that... • It is very difficult to determine if the change in count from year to year is due to a change in geometry, traffic volume, or traffic control device • It can frustrate efforts to reduce crashes (a change was made but crashes increased) • It can fool us into thinking a change that we made significantly reduced crashes (when it really did not)
Crash Data Variability • Questions • What is the true mean crash frequency at this site? • Is a 3-year average reliable? Each data point represents 1 year of crash data at one site
Crash Data Variability • Observations • The average of 3 years (= 6 crashes)... • 2.0 crashes/yr • 0.7 to 4.3 crashes/yr (± 115%) • The average of 35 years (= 100 crashes)… • 2.8 crashes/yr • 2.2 to 3.3 (± 20%) • One site rarely has enough crashes to yield an average with a precision of ± 20%
Influence of Design • Question • 15 intersections have left-turn bays added • Research shows bays reduce crashes by 20% • What crash frequency do you expect for site 4 after the bay is installed? Average = 10 Each data point represents 1 year of crash data
Influence of Design • Observations • Random variation makes trend difficult to see • Most sites show crash reduction • Site 4, and a few other sites, had more crashes • This does not mean bay won’t be effective in long run
Influence of Design • Observations • Distribution of crash change for sites with average of 10 crashes/yr and 20% reduction • When reduction is small, random variation will let crash frequency increase at some sites in the year after
Overcoming Variability • Large variability makes it difficult to observe a change in crash frequency due to change in geometry at one site • Large variability in crash data may frustrate attempts to confirm expected change • Large databases needed to overcome large variability in crash data • Statistics must be used to accurately quantify effect
Background Research • National Research Sources • Safety design guidelines • NCHRP Report 500: Guidelines for Implementing the AASHTO Strategic Highway Safety Plan • Vol. 5: Unsignalized intersections • Vol. 7: Horizontal curves • Vol. 8: Utility poles • Vol. 12: Signalized intersections • Vol. 13: Heavy trucks • Volumes can be found at: http://safety.transportation.org/guides.aspx
Background Research • National Research Sources • Safety evaluation tools • Interactive Highway Safety Design Model • Safety Analyst (forthcoming) • Highway Safety Manual (forthcoming) • Prediction of the Expected Safety Performance of Rural Two-Lane Highways FHWA FHWA NCHRP FHWA
Background Research • TxDOT Project 0-4703 • “Incorporating Safety into the Highway Design Process” • Project Director: • Elizabeth Hilton • Main products: • Roadway Safety Design Synthesis (Report 0-4703-P1) • Interim Roadway Safety Design Workbook (Report 0-4703-P4) Available at: tcd.tamu.edu, click on “Products”
IHSDM Two lane highways Highway Safety Manual Two lane highways (& intersections) Rural multilane highways (& intersections) Urban streets (& intersections) TxDOT 0-4703 Freeways Rural highways Multilane rural Two lane rural Urban streets Freeway ramps Urban intersections Rural intersections Facility Types
Safety Prediction Procedures • Overview • Six steps to procedure • Evaluate a specific roadway segment or intersection (i.e., facility component) • Same basic technique for all methods (IHSDM, HSM, TxDOT 4703) • Output • Estimate of crash frequency for segment or intersection
Step 1 • Identify Roadway Section • Define limits of roadway section of interest • Limits of design project • Portion of highway with safety issue or concern • May include one or more components
Step 2 1 2 4 3 • Divide Section into Components • Analysis based on facility components • One intersection or • One interchange ramp or • One roadway segment • Each component analyzed individually in Steps 3 and 4
Homogeneous Segment • Definition • A homogeneous segment has the same basic character for its full length • Lane width • Shoulder width • Number of lanes • Curvature • Grade • Horizontal clearance
Step 3 • Gather Data for Subject Component • Data may include • Roadway geometry (lane width, etc.) • Traffic (ADT, truck percentage, etc.) • Traffic control devices (stop sign, signal) • What data do I need? • It depends on the component…
Step 4 • Compute Expected Crash Frequency • Use safety prediction model • Model Components • Base model • Accident modification factors Volume Lane Width Expected Crash Frequency
Base Model • Relationship • Cb = base crash rate × volume × length • Injury (plus fatal) crash frequency • Calibration • Analyst can adjust crash rate to local conditions • Application • Crash frequency for “typical” segment • Typical: 12 ft lanes, 8 ft outside shoulder, etc.
Accident Modification Factors • Definition • Change in crash frequency for a specific change in geometry • Adapts base model to non-base conditions • One AMF per design element (e.g., lane width) • Example: Two-lane highway • Base condition: 12 ft lanes • Roadway has 10 ft lanes • AMF = 1.12
Steps 5 & 6 • Repeat Steps 3 and 4 for Each Component • Add Results for Roadway Section • Add crash estimates for all components • Sum represents the expected crash frequency for the roadway section • If there are multiple alternatives, repeat Steps 1 through 6 for each alternative
More Information • Safety Resources from Project 0-4703 • Workbook • Synthesis • Procedures Guide • Texas Roadway Safety Design Software • Web Address • http:// tcd.tamu.edu/documents/rsd.htm • Also link from DES-PD site CROSSROADS • Check periodically for updates (Coming soon…)