Download
1 / 175
1.76k likes | 1.93k Views
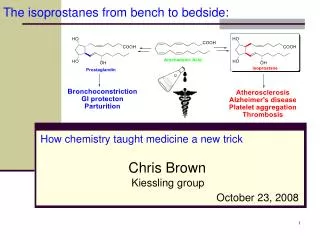
From bench to the bedside Statistics Issues in RCT. Ferran Torres Biostatistics and Data Management Platform IDIBAPS - Hospital Clinic Barcelona Universitat Autònoma Barcelona. EMA: Scientific Advice Working Party (SAWP) Biostatistics Working Party (BSWP). Disclaimer.

E N D
Frombenchtothebedside StatisticsIssues in RCT Ferran Torres Biostatistics and Data Management Platform IDIBAPS - Hospital Clinic Barcelona UniversitatAutònoma Barcelona. EMA: Scientific Advice Working Party (SAWP) BiostatisticsWorkingParty (BSWP).
Disclaimer • The opinions expressed today are personal views and should not be understood or quoted as being made on behalf of any organization. • Regulatory • Spanish Medicines Agency (AEMPS) • European Medicines Agency (EMA) • Scientific Advice Working Party (SAWP) • Biostatistics Working Party (BSWP) • Hospital - Academic - Independent Research • IDIBAPS. Hospital Clinic Barcelona • Autonomous University of Barcelona (UAB) • SCREN. SpanishClinicalTrialsPlatform
Documentation http://ferran.torres.name/edu/stats_rct • Power Point presentation • Selected References • Direct links to guidelines Password: stats_rct
LACK OF HARMONISATION INTERNATIONAL CONFERENCES HARMONISATION www.ich.org USA JAPAN Similar Basic Technical Requirements Data to register in all regions EU
Regulatory Guidances • CPMP/EWP/908/99 CPMP Points to Consider on Multiplicityissues in Clinical Trials • CPMP/EWP/2863/99 Points to Consider on Adjustment for BaselineCovariates • CPMP/2330/99 Points to Consider on Application with 1.) Meta-analysesand 2.) One Pivotal study • Choice of a Non-Inferiority Margin CPMP/EWP/482/99 Points to Consider on Switching between Superiority and Non-inferiority • CPMP/EWP/1776/99 Points to Consider on Missing Data • CHMP/EWP/83561/05 Guideline on Clinical Trials in Small Populations • CHMP/EWP/2459/02 Reflection Paper on Methodological Issues in Confirmatory Clinical Trials with Flexible Design and Analysis Plan
“Scientific Recomendations” • Consort Statement: Summary, // General, // non-inferiority • Lancet: Series de Methodological & Stats Series • BMJ: Statistics Notes (Bland & Altman) or in BMJ 10 10
Basic statistics Why Statistics? Samples and populations P-Value Statistical errors Sample size Confidence Intervals Interpretation of CI: superiority, non-inferiority, equivalence
The role of statistics “Thus statistical methods are no substitute for common sense and objectivity. They should never aim to confuse the reader, but instead should be a major contributor to the clarity of a scientific argument.” The role of statistics. Pocock SJ Br J Psychiat 1980; 137:188-190
Why Statistics? Variation!!!!
SAMPLE AND POPULATIONS P-VALUE AND CONFIDENCE INTERVALS BACKGROUNG
Population and Samples Sample Population of the Study Target Population
Extrapolation Study Results Sample Inferential analysis Statistical Tests Confidence Intervals Population “Conclusions”
P-value The p-value is a “tool” to answer the question: Could the observed results have occurred by chance*? Remember: Decision given the observed results in a SAMPLE Extrapolating results to POPULATION *: accounts exclusively for the random error, not bias p < .05 “statistically significant”
P-value: an intuitive definition • The p-value is the probability of having observed our data when the null hypothesis is true (no differences exist) • Steps: • Calculate the treatment differences in the sample (A-B) • Assume that both treatments are equal (A=B) and then… • …calculate the probability of obtaining a magnitude of at least the observed differences, given the assumption 2 • We conclude according the probability: • p<0.05: the differences are unlikely to be explained by random, • we assume that the treatment explains the differences • p>0.05: the differences could be explained by random, • we assume that random explains the differences
Factors influencing statistical significance • Difference • Variance (SD) • Quantity of data • Signal • Noise (background) • Quantity
P-value. Some reflexions • Tell us NOTHING about clinical or scientific importance. Only, that the results were not due to chance. • A “very low” p-value do NOT imply: • Clinical relevance (NO!!!) • Magnitude of the treatment effect (NO!!) With n or variability p • Please never compare p-values!! (NO!!!)
Interval Estimation Intuitive interpretation: “A probability that the population parameter falls somewhere within the interval” Sample statistic (point estimate) Confidence interval Confidence limit (lower) Confidence limit (upper)
95%CI • Better than p-values… • …use the data collected in the trial to give an estimate of the treatment effect size, together with a measure of how certain we are of our estimate • CI is a range of values within which the “true” treatment effect is believed to be found, with a given level of confidence. • 95% CI is a range of values within which the ‘true’ treatment effect will lie 95% of the time • Generally, 95% CI is calculated as • Sample Estimate ± 1.96 x Standard Error
Superiority study Control better Test better IC95% d < 0 - effect d = 0 No differences d > 0 + effect
STATISTICAL ERRORS SAMPLE SIZE MINIMUM IMPORTANT CLINICALY IMPORTANT DIFFERENCE (MICD) DESIGN
Type I & II Error & Power • Type I Error (a) • False positive • Rejecting the null hypothesis when in fact it is true • Standard: a=0.05 • In words, chance of finding statistical significance when in fact there truly was no effect • Type II Error (b) • False negative • Accepting the null hypothesis when in fact alternative is true • Standard: b=0.20 or 0.10 • In words, chance of not finding statistical significance when in fact there was an effect
CxVariance n = (MICD)2 C: function of and MICD:Minimum Important Clinically Difference Sample size and MICD
Minimum Important Clinically Difference (MICD or MID) • “Smallest difference that is considered clinically important, this can be a specified difference (the Minimum Important Clinically Difference (MICD)” • One can observe a difference between two groups or within one group over time that is statistically significance but small. • With a large enough sample size, even a tiny difference could be statistically significant. • The MID is the smallest difference that we care about.
ABBSOLUTE AND RELATIVE DIFERENCES Effect scales
Absolute and Relative Scales • Incidence events / population at risk • Absolute Risk Reduction (ARR) Incidence in Test – Incidence in control • Relative Risk Reduction (RRR) (Incidence in Test – Incidence in control) / Incidence in control • Number Needed to Treat (NNT) 1/ ARR • Relative Risk (RR) Incidence in Test / Incidence in control
Absolute and Relative effects Risks …
RR & OR • RR or OR > 1 • RR or OR =1 • RR or OR < 1 Risk Factor Absence of effect Protection Factor
RR=2 • Rate in Exposed • 2/4 => 0.50 • Rate in non-Exposed • 1/4 => 0.25 Non-Exposed Exposed • Odds in Exposed: 2/2=> 1 • Odds in non-Exposed 1/3 OR=3 RR & OR Ills
Example • Treatment A: relative risk of 0.81 • Treatment B: reduction of 19% in risk • Treatment C: absolute rate reduction of 3% • Treatment D: survival increase from 84% to 87% • Treatment E: relative mortality reduction of 19% • Treatment F: avoids 1 death per 33 treated patients
Example • Treatment A: relative risk of 0.81 RR = 13% / 16% => 0.81 • Treatment B: reduction of 19% in risk RRR = 1-0.81 => 19% • Treatment C: absolute rate reduction of 3% ARR = 16% - 13% => 3% • Treatment D: survival increase from 84% to 87% ARR = 87%-84% = 16% - 13% = 3% • Treatment E: relative mortality reduction of 19% RRR = (16%-13%) / 16% = 19% o bé 100*(1-RR) => 19% • Treatment F: avoids 1 death per 33 treated patients NNT = 33; ARR = 1/33 = 0,3 = 3%
SUPERIORITY, NON-INFERIORITY AND EQUIVALENCE DESIGNS CLINICAL RELEVANCE-INTERPRETATION
Superiority study Control better Test better IC95% d < 0 - effect d = 0 No differences d > 0 + effect
Superiority 1 2 3 4 5 0 <- Treatment less effective Treatment more effective -> Treatment-Control
Equivalence Upper equivalence boundary Lower equivalence boundary 1 2 3 4 5 0 <- Treatment less effective Treatment more effective -> Treatment-Control
Non-Inferiority Lower equivalence boundary 1 2 3 4 5 0 <- Treatment less effective Treatment more effective -> Treatment-Control
1/2 ? 1/3 ? B A d 30% P
d 30%