Download
1 / 17
170 likes | 327 Views
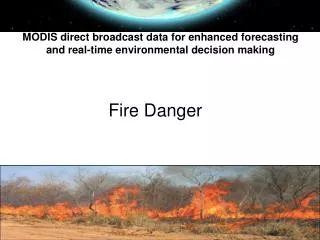
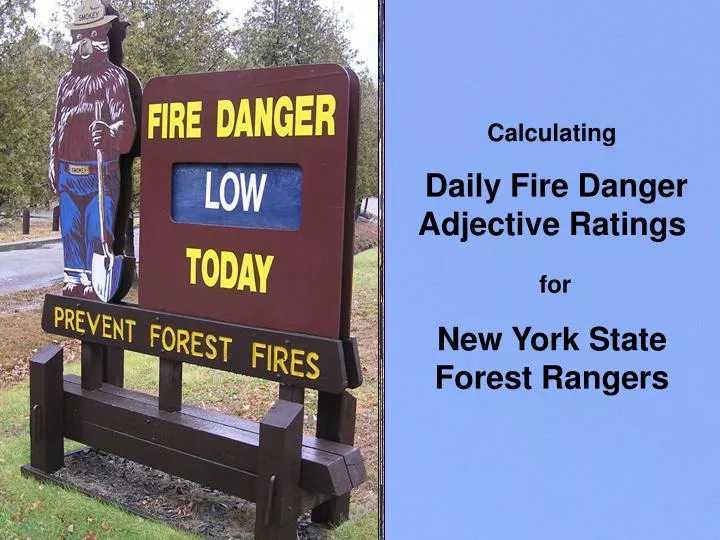
Calculating Daily Fire Danger Adjective Ratings for New York State Forest Rangers. Adjective Rating is a standard fire danger product used to convey the current fire danger rating in common descriptive terms.

E N D
Calculating Daily Fire Danger Adjective Ratings for New York State Forest Rangers
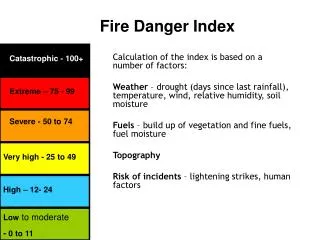
Adjective Rating is a standard fire danger product used to convey the current fire danger rating in common descriptive terms. Adjective Ratings allow fire danger information to be easily understood by fire management personnel, and can be used to convey the relative severity of the current fire danger situation to the general public.
Adjective Rating Color Codes and Class Descriptions are standard National Wildfire Coordinating Group (NWCG) Definitions
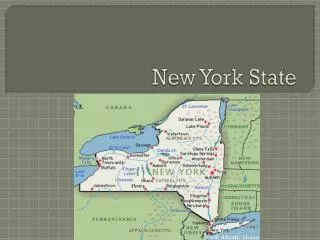
Fire Danger Rating Areas are geographic areas of similar vegetation, climate, and topography modified by absolute criteria. There is at least one representative RAWS located in each FDRA
Adjective Rating is set daily for each of the 10 Fire Danger Rating Areas August 28, 2004
How? The Daily Fire Danger Adjective Rating for each FDRA in New York is calculated from current and historic weather data and fire occurrence records using the National Fire Danger Rating System (NFDRS). The daily fire weather data is obtained from the RAWS network, the historic weather data is obtained from WIMS, and the historic fire occurrence data is obtained from the Agency.
Historic weather data is obtained from KCFast, a subset of WIMS
The data is entered into a fire analysis program called FireFamily Plus. This program combines the historic weather and fire data producing an array of NFDRS outputs such as ERC, BI, KBDI, 1000 hr. fuel moistures, etc.
FireFamily Plus allows selection of fire occurrence data based on Agency criteria. New York uses administrative Regions, Counties, and Towns as the sub-units that define Fire Danger Rating Areas.
FireFamily Plus allows the fire manager to graphically identify “fire business thresholds”. These thresholds identify output values that equate to historic fire occurrence. Fire business thresholds are unique to each Fire Danger Rating Area and are defined in the Agency’s Fire Danger Operating Plan. These threshold values are used to set decision points for adjective rating.
These threshold values are used to set “decision points” for adjective rating. Decision Points!
Example: Moderate = 15 High = 25 Very High = 30 Extreme = 36 Analysis tools in FireFamily Plus allow the fire manager to edit the selected decision points to fit various local and Agency criteria such as fuel model, values at risk, fire fighting resources, accessibility, land use parameters, etc.
These decision point values are then applied to the seasonality graph of the particular RAWS. Seasonality graphs portray the history of a specific NFDRS product over the record life of the station, and allow the fire manager to track current values and trends relative to the station history. The average and maximum value lines provide a quick summary of the stations NFDRS characteristics!
High Moderate 2004 Seasonality Graph of a Station’s Weather Data
The seasonality graph is where the NWS NFDRS Point Forecast is used by combining the current annual trend with the daily forecast. For example, if today is 8/1, and the point forecast for 8/2 is an ERC of 25, we know we will be at or least continuing to trend toward High fire danger.
High 25 Moderate NFDRS Point Forecast Value 2004 Seasonality Graph of ERC for the Schuyler Falls RAWS
That’s it! Questions? Comments?