Difference Two Groups
Difference Two Groups. Part 2 Calculation of t-test Data and Definition Guided analyses and interpret tests based on mean (Independent t-test assuming equal variance and assuming unequal variance). Visual Concept of t-test. http://www.psych.utah.edu/stat/introstats/anovaflash.html.

Difference Two Groups
E N D
Presentation Transcript
Difference Two Groups Part 2 Calculation of t-test Data and Definition Guided analyses and interpret tests based on mean (Independent t-test assuming equal variance and assuming unequal variance)
Visual Concept of t-test http://www.psych.utah.edu/stat/introstats/anovaflash.html
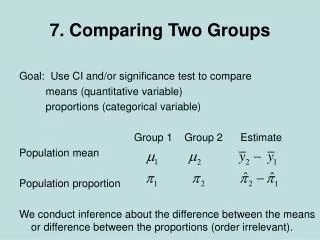
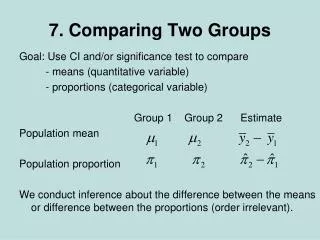
Statpages.org Tabled t Calculated t
Three ways to reject the null Ho and Accept the alternative Ha hypothesis • Calculated significance (p value) is less than established alpha level • Calculated t, Z, or Chi-square value is greater than tabled value • The confidence interval of difference does not contain 0 within the range of values
Study Design Thirty participants, 15 per group, were randomly assigned into a traditional diabetic treatment group or into a patient/family centered treatment group. After a year of treatment, the participants were measured on the SIP1. R X standard of care O R X experimental treatment O What is your scale of measurement for the dependent variable?
Problems Skewness and Kurtosis?Remember not a problem if degree is between – 1.96 and +1.96
Normal Distribution Each Group?Remember if p-values is greater than Level of Significance then you can assume normal distribution
F-Test Equality of VarianceRemember if p-values is greater than alpha of 0.05 you can assume equal variance. Above is output from Vassarstats.org using independent t-test
Given what you should know at this point, what test would you select? • Two Groups? • Scale of measurement for the dependent variable? • Normal distribution each group? • Groups have equal variance? Which of the following tests would you select? • Independent t test equal variance assumed • Independent t test equal variance not assumed • Mann-Whitney U • Chi-Square (Fisher Exact)
Independent t-test equal variance 95% to add and subtract from mean difference
Problems Skewness and Kurtosis?Remember not a problem if degree is between – 1.96 and +1.96
Normal Distribution Each Group?Remember if p-values is greater than Level of Significance then you can assume normal distribution
F-Test Equality of VarianceRemember if p-values is greater than alpha of 0.05 you can assume equal variance. Above is output from Vassarstats.org using independent t-test
Given what you should know at this point, what test would you select? • Two Groups? • Scale of measurement for the dependent variable? • Normal distribution each group? • Groups have equal variance? Which of the following tests would you select? • Independent t test equal variance assumed • Independent t test equal variance not assumed • Mann-Whitney U • Chi-Square (Fisher Exact)
Abstract The purpose of this study was to determine if there was a difference in Sickness Impact Profile (SIP) scores between two treatment groups for medical management of diabetes mellitus (DM). Thirty participants, 15 per group, were randomly assigned into a traditional diabetic treatment group or into a patient/family centered treatment group. In this post test only active control group design, SIP scores were measured following one year of treatment to determine difference between the two treatment groups. The SIP mean and standard deviation for the traditional treatment was 22.47 (9.21) and 152 (4.42) for the prevention group. The mean difference of 7.27 between the treatment groups is greater than the reported value of 5 being clinically relevant. Since the assumption of equal within group variance was not supported, an independent t test for equal variance not assumed was used to determine statistical difference. The t-test result t(16.99) = 2.9 p = 0.01 indicated that the groups differed statistically at an alpha .05 level. The 95% confidence interval of difference between the means ranged from 2.31 to 12.22. The null hypotheses is rejected and it is inferred that patient/family centered treatment have lower SIP scores when compared to traditional diabetic treatment. The degree of difference between the groups has both statistical and clinical relevance.