Laser system schematic
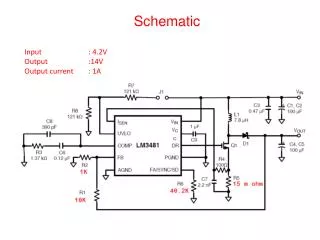
Laser system schematic. 200 s, 5-50 Hz. Phase coding. 400 s, 5-50 Hz. Diode pump 22 kW pk. 1.55 s. Diode pump 18 kW pk. Feedback stabilisation. Optical gate (Pockels cell). Energy stabiliser (Pockels cell). 1.5 GHz Nd:YLF oscillator. CW preamp. 3-pass Nd:YLF amplifier

Laser system schematic
E N D
Presentation Transcript
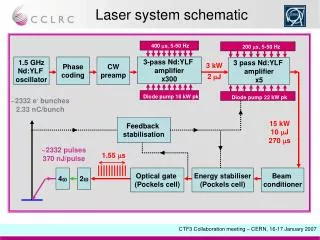
Laser system schematic 200 s, 5-50 Hz Phase coding 400 s, 5-50 Hz Diode pump 22 kW pk 1.55 s Diode pump 18 kW pk Feedback stabilisation Optical gate (Pockels cell) Energy stabiliser(Pockels cell) 1.5 GHz Nd:YLF oscillator CW preamp 3-pass Nd:YLF amplifier x300 3 pass Nd:YLF amplifier x5 3 kW 2 J 200 s, 5-50 Hz ~2332 e- bunches 2.33 nC/bunch 15 kW 10 J 270 ms ~2332 pulses 370 nJ/pulse 4 2 Beam conditioner CTF3 Collaboration meeting – CERN, 16-17 January 2007
Practical layout High Qpreamp High Qoscillator Coding 300 cm Amp 1 Noisecontrol Faraday isolator HG HG 1.54 msslicing 1 pulseslicing Thermallensing correction Amp 2 CTF3 Collaboration meeting – CERN, 16-17 January 2007
Amplifier head design The rod Glass tube • 5 Diode laser stucks • 18 kW total peak power – Amp. 1 • 22 kW total peak power – Amp. 2 • 400 ms – Amp.1 • 200 ms – Amp.2 Laser head assembly Lens Diodes water • Nd:YLF rod • 7mm diameter 8 cm long – Amp. 1 • 10 mm diameter 11 cm long – Amp. 2 • 1% doping level • Deep surface etching for higher fracture limit CTF3 Collaboration meeting – CERN, 16-17 January 2007
Amplifier 1 • Amp 1 operational and tested at 5 Hz and 50 Hz • Rod failure at 50 Hz may be due to non-saturated operation • Expected output has been delivered (actually slightly exceeded) • Near-field uniformity should improve with better rod CTF3 Collaboration meeting – CERN, 16-17 January 2007
Amplifier 1 • Measured output from Amp 1exceeds target power (3 kW from 3 passes) • Output saturates in agreementwith model Near-field profile is flattened by saturationbut shows some effectsof rod inhomogeneities Measured at CERN Measured at RAL CTF3 Collaboration meeting – CERN, 16-17 January 2007
Amplifier 2 • 10kW from Amp 2 corresponds to 6.7mJ/pulse • Beam uniformity is better than Amp 1 (fine fringes are an artefact) but rod is underfilled • Overfilling improves saturation so steady state is reached but energy is reduced CTF3 Collaboration meeting – CERN, 16-17 January 2007
Pulse slicing • Risetime is ~4ns • Extinction ratio, throughput and level of induced noise remain to be optimised (noise level in above trace is misleading) • Power handling, with additional AOM, remains to be confirmed • Test of 1.54ms Pockels cell and driver confirms triggering and basic operation CTF3 Collaboration meeting – CERN, 16-17 January 2007
Frequency multiplying • Crystals are available for • two frequency quadrupling • schemes: • 2 × type I in BBO (preferred) • Type II in KTP + type I in BBO (allows two IR polarisations,perhaps for 3 GHz multiplexing) • Tests with Amp 1 (low energy) showed an IR-UV conversion efficiency of up to 7% • Extrapolation to Amp 2 should allow system specification to be met CTF3 Collaboration meeting – CERN, 16-17 January 2007
Task listing Oscillator & preamplifier Complete – April 2005 Amplifier 1 (5 Hz) Complete – April 2006 1.54 ms slicing (no AOM) Demonstrated – July 2006 Amplifier 2 (5 Hz) Demonstrated – July 2006 Phase coding Designed Frequency multiplying Demonstrated with Amp 1 – August 2006 Safety and machine protection After delivery Coding finalisation After delivery Frequency multiplying finalisation After delivery Amplitude stabilisation After delivery Single-pulse and AOM slicing After delivery 50 Hz testing After delivery 50Hz thermal lensing correction After delivery Laser system shipped from RAL to CERN at end of August 2006 CTF3 Collaboration meeting – CERN, 16-17 January 2007
HighQ amplifier Flipping mirrors Laser beam to CALIFES Faraday isolator f = - 250 mm 1st amplifier HighQ oscillator l/2 f = 300 mm f = -100 mm Beam dump 2nd amplifier f = 100 mm Phase coding f = - 150 mm f = 400 mm Pockels cell BBO SHG f = 800 mm f = - 100 mm BBO FHG f = 300 mm Breadboard Laser beam to cathode Lasers at CERN • Oscillator in operation – September 2006 • Preamplifier in operation after service by High Q Laser – November 2006 • Amplifier 1 in operation – November 2006 • Amplifier 2 assembled and tested (beams not optimized) – January 2007 CTF3 Collaboration meeting – CERN, 16-17 January 2007
CERN installation Amplifier 1 Preamplifier Amplifier 2 Pulse slicing Pockels cell Oscillator Fiber-optics coding system CTF3 Collaboration meeting – CERN, 16-17 January 2007
Amplifiers hardware Drivers for 5 diode laser stucks of Amplifier 2 120 A each Chillers for amplifier diodes 55 l/min and 75 l/min Amplifier 2 CTF3 Collaboration meeting – CERN, 16-17 January 2007
Pulse coding 140.7 + 0.333 ns delay 140.7 ns macropulses 320 mW in from oscillator Variable delay ~30 mW out to preamp EO Modulator Variable attenuator • Fibre modulation, based on telecoms technology, is fast but lossy andlimited in average power • Measurements on the High Q system suggest 10dB loss before the preamp results in <3dB output reduction • Delay can be adjusted by varying the fibre temperature (~0.5ps/°C) • Attenuation can be controlled by varying the fibre bending losses • Preliminary assembly and tests of temperature tuning were carried out at RAL CTF3 Collaboration meeting – CERN, 16-17 January 2007
Pulse slicing with AOM QS41-5C-S-SS2 Input from Amp 2 Output to doubler AO Deflector Pockels cell RF Driver Pockels Driver AO deflector could reducepower loading on Pockels cellby up to 80% for most ofthe macropulse CTF3 Collaboration meeting – CERN, 16-17 January 2007
Timing for CLEX Probe-beam CTF3 Collaboration meeting – CERN, 16-17 January 2007
Thank you for your attention Acknowledgments RAL Marta Dival Graeme Hirst Kurdi Gabor Emma Springate Bill Martin Ian Musgrave CERN Guy Suberlucq Roberto Losito Nathalie Champault Arvind Kumar CTF3 Collaboration meeting – CERN, 16-17 January 2007