Download
1 / 31
310 likes | 515 Views
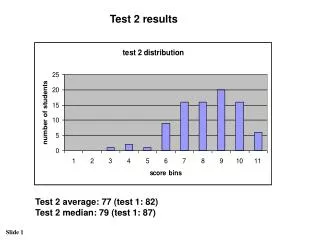
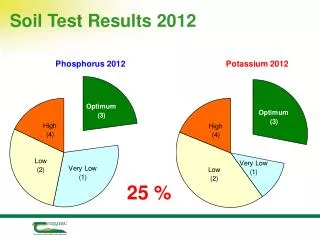
Soil Test Results 2012. 25 %. Maintaining Optimum Soil Fertility – Focus on Offtake. Stan Lalor, David Wall, and Mark Plunkett Teagasc, Crops Environment and Land Use Programme, Johnstown Castle, Wexford. Fertilizer Association of Ireland Spring Scientific Meeting 5 Feb 2013

E N D
Maintaining Optimum Soil Fertility– Focus on Offtake Stan Lalor, David Wall, and Mark Plunkett Teagasc, Crops Environment and Land Use Programme, Johnstown Castle, Wexford. Fertilizer Association of Ireland Spring Scientific Meeting 5 Feb 2013 Horse and Jockey
Overview • 5 Steps to Soil Fertility Management • Nutrient advice based on offtake • Nutrient Wheel as a tool for calculating offtake
1) Soil Test 3) Index 3 5) Balance 4) Slurry 2) Soil pH Steps to Soil Fertility Management
1) Soil Test 3) Index 3 5) Balance 4) Slurry 2) Soil pH Steps to Soil Fertility Management
P & K • Convert test result into soil Index • Target = All soils in Index 3 for P and K ! • Only ~ 25% at present
Soil Index & Advice Index 4: Draw on soil reserves Index 1 & 2: Requires additional nutrients to build soil reserves Target Index 3: Maintain balance Build up Build up Advice Nutrient offtake Maintenance Replace offtake Maintenance Replace offtake Maintenance Replace offtake 1 2 3 4 Soil Index
No Build-up rate required in Index 3 or 4 Soil P and K build up - Grassland Apply build up + maintenance in Index 1 and 2 Apply for 5 years or until soil test shows increase
Lime Organic Manures Sulphur Layout Soil Fertility information P & K Build-up rates for different crops Grassland offtakes “M” = maintenance Dairy Grazing Drystock Grazing Silage Crops (incl. Maize & Wholecrop)
Layout – Tillage Crops Tillage offtakes “M” = maintenance Cereals Oilseeds, Peas & Beans Root Crops Magnesium
How to use the Nutrient Wheel • Dial up the expected crop yield (tillage and forage crops) or stocking rate (grazed swards). • Make sure the colour on the wheel matches that for the crop being calculated. • Estimate P and K requirements by adjusting the P and K offtake for soil P and K Index and organic manure applications.
Grassland Example • Grazed field • Dairy farm • Stocked at 165 kg/ha Org N • 0.5 t/ha of concentrate • Soil P and K Index 1 • 22 m3/ha cattle slurry
Grassland Example • Grazed field • Dairy farm • Stocked at 165 kg/ha Org N • 0.5 t/ha of concentrate • Soil P and K Index 1 • 22 m3/ha cattle slurry
Grassland Example • Grazed field • Dairy farm • Stocked at 165 kg/ha Org N • 0.5 t/ha of concentrate • Soil P and K Index 1 • 22 m3/ha cattle slurry
Tillage Example • Winter oilseed rape (straw removed) • Yield of 4 t/ha • P Index 2 and K Index 3, • 5 t/ha poultry manure (layers litter)
Tillage Example • Winter oilseed rape (straw removed) • Yield of 4 t/ha • P Index 2 and K Index 3, • 5 t/ha poultry manure (layers litter)
Tillage Example • Winter oilseed rape (straw removed) • Yield of 4 t/ha • P Index 2 and K Index 3, • 5 t/ha poultry manure (layers litter)
Cross Compliance Check • Whole Farm Compliance with Nitrates Regulations still essential
Soil Testing – Why? Recent Survey – Only 41% of samples are used for fertilizer planning Mainly used only for cross-compliance Soil Test for yourself - Not for the Inspector !!!!!
Can we afford to ignore soil fertility management ?? 25 % Can you afford to be wrong in 75% of fields?
Save Money in Index 4 • Example • Dairy – 2 cows / ha • Index 3 advice (grazing) = 14 kg/ha P & 30 kg/ha K • Cost of P and K = €58 /ha • Soil Test shows Index 4 • Save €58 /ha/yr until drops to Index 3 Drystock: Lower advice €35 /ha/yr @ 2 LU/ha
Soil pH needs to be right as well ! Lost production in Index 1 • Production loss in Index 1 vs. Index 3 • Approximately 1.5 t/ha/yr of grass DM • Worth €400 /ha/yr ? • Additional P and K for build up = 20 kg/ha P & 60 kg/ha K • Additional Cost = €100 ha/yr until soil P / K increases • Long-term investment
Variation in Soil test results Potassium Phosphorus • Not all the farm is the same – different fertilizers needed in different fields • Often higher fertility close to farmyard – slurry • High P does not always mean high K Fu et al 2010
N P KFertilizer N PFertilizer KFertilizer Nutrient Balance – What is the Weakest Link ? • Nutrient in shortest supply limits determines yield • Fertilizer Planning • Soil tests & Cropping • Slurry & fertilizers • Straight K • N-P products • N-K products Products need to be suited to what the fields need
Soil Fertility Management Targets • Have soil analysis for whole farm • Apply lime as a priority to correct soil pH • P and K Index 3 in all fields • Index 4 is a resource Exploit it • Index 1 & 2 need additional inputs • Replace offtakes at Index 3 • Optimise slurry first – then top up with fertilizer as required • Fertilizer inputs in proper balance • Fertilizer planning is key to this