Download
1 / 26
640 likes | 1.8k Views
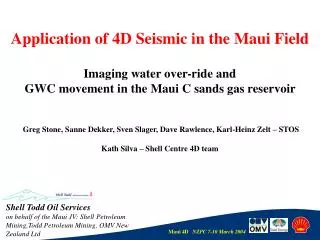
Application of 4D Seismic in the Maui Field Imaging water over-ride and GWC movement in the Maui C sands gas reservoir Greg Stone, Sanne Dekker, Sven Slager, Dave Rawlence, Karl-Heinz Zelt – STOS Kath Silva – Shell Centre 4D team. Shell Todd Oil Services

E N D
Application of 4D Seismic in the Maui Field Imaging water over-ride and GWC movement in the Maui C sands gas reservoir Greg Stone, Sanne Dekker, Sven Slager, Dave Rawlence, Karl-Heinz Zelt – STOS Kath Silva – Shell Centre 4D team Shell Todd Oil Services on behalf of the Maui JV: Shell Petroleum Mining,Todd Petroleum Mining, OMV New Zealand Ltd
Maui background What is 4D? Feasibility study, 4D acquisition & processing 4D interpretation Summary Outline
Introduction to the Maui Field • Largest producing field in New Zealand providing a major part of the country’s natural gas • Discovered in 1969, at that time one of the largest gas fields in the world • 3 main Eocene, Kapuni Gp reservoir units in each; the C, D & F sands. • Maui comprises two low relief structures termed Maui-A & Maui-B • 8 exploration/appraisal wells. • 26 development wells. • 1000 km2 3D seismic survey, acquired 1991, reprocessed 1999. Maui A Maui B
Large field; areal coverage of 15x30km. 34 wells have been drilled. Majority of these wells are on the crests of the A and B structures. Poorly constrained flanks result in large structural uncertainty, and in turn many different combinations of GRV and fault seal scenarios (e.g. West of Ihi fault zone). Highly layered reservoir with vertical barriers to flow, and strong aquifer. Results in flank water influx and water over-riding gas. The location and producibility of remaining gas is uncertain and may be related to unknown sealing faults, undrained attics or stratigraphic baffles. MB09 Hydrocarbon Saturation logs MB-09 water-overrun MB-09 GWC rise 2001 RST-A 1999 TDT-P 1993 OH Logs Production Challenges of Maui C Sands
Maui background What is 4D? Feasibility study, 4D acquisition & processing 4D interpretation Summary Outline
What is 4D (Time-Lapse) Seismic? Production GOC GWC Measure changes in: acoustic impedance (reflections) and/or travel times.Changes are caused by fluid, pressure/stress, temperature.Visualise SHC, P or T all over your field (away from wells).Maui: 4D seismic measures the acoustic impedance changes related to Shc changes
Maui background What is 4D? Feasibility study, 4D acquisition & processing 4D interpretation Summary Outline
2001 – feasibility study 2001 – test swath acquired May 2002 – full 3D monitor data acquired Dec. 2002 – monitor and base data processed by SGS 2003 and ongoing – interpretation and closing the loop Maui B Platform D-Sand Production Maui B Platform C-Sand Production Maui A Platform C-Sand Production Maui A Platform D-Sand Production Maui Timelapse Seismic Maui 3D Seismic 1975 1980 1985 1990 1995 2000 2005 Maui 4D History Base Survey Monitor Survey Test swath Test swath Maui A Maui B
Is 4D feasible for Maui Gas Field? • Positive points • Good quality 1991 seismic data • Strong hydrocarbon effect observed • Sharp large gas-water contact rise since start of production • Negative points • Impedance differences through gas production normally small • Limited industry experience/successes with 4D gas cases • Feasibility Study • 1. 1D&3D Feasibility modelling • 2. Test Swath Data • Conclusion • Time-lapse seismic in the Maui C sands gas field is proven feasible • Vertical GWC movement and lateral movement of water in over-ride zones are both observed, and could be mapped by full field 4D.
S S S N N N Top C sand MB09 Water overrun MB-09 Base synthetic difference 2001-1991 New Dynamic model 4D difference synthetic from new MoReS model: including water override at MB-09 Water overrun MB-09 Measured test line difference 2001-1991 Test line 4D difference 2001 RST-A Base synthetic difference 2001-1991 Old Dynamic model Original GWC 4D difference synthetic from old MoReS model: no water override modelled Measured difference 2001-1991 MB-09 Water overrun gas Maui B test Line 164 difference compared with Synthetic models 2001 - 1991 water Gas-Water distribution 2001 New Dynamic model overlaid with test line
Base SurveyQuad Quad 4D Data Acquisition • Base Survey: Quad Quad shot by Western Geco (Jan-April 1991) • Different acquisition geometry for monitor survey as for technical reasons duplication of Quad Quad configuration was perceived not to be necessary and more expensive • Monitor Survey: Dual Hex (6 streamer, 2 sources) configuration shot by PGS with M/V Nordic Explorer (March-May 2002) • The subsurface coverage is the same for both surveys despite the different acquisition geometries • STOS imposed a 500m vessel exclusion zone about both the Maui-A and Maui-B platform facilities and a 1000m limit around the FPSO. This resulted in data holes Monitor SurveyDual Hex
Processing done by Shell Geoscience Services SGS in the Netherlands (May-Dec 2002) Base data reprocessed in parallel with processing of Monitor data, using exactly the same processing parameters Dedicated 4D processing based on Shell’s global experience Data quality excellent, good repeatability 4D Processing
Maui background What is 4D? Feasibility study, 4D acquisition & processing 4D interpretation Summary Outline
Interpretation: Mapping of coherent events on the seismic difference cube Comparison of time-lapse observations with well data Modelling: Detailed synthetic modelling of time-lapse response expected at well locations Field-wide synthetic generation, from dynamic reservoir model Integration into the dynamic reservoir model: Make dynamic reservoir model consistent with timelapse observations (iterative process – closing the loop) 4D Interpretation
Synthetic difference data, 2002- 1991 Top flank water override 100% Gas Base flankwater override 2002 GWC 1991 GWC 2002 saturations with synthetic difference data 2002- 1991 100% Brine Real difference data, 2002- 1991 Top C 3 1 2 3 4 1 2 3 2 2 1 4 3 4 1 4 4D Interpretation Results Timelapse = monitor - base
Flank water influx from south and north into Maui A platform is clearly defined No Timelapse difference (Sw unchanged) Timelapse difference (increase in Sw) Key Findings from 4D Data Map of flank water influx from dynamic reservoir model.(Top C Sands amplitude extraction). Top flank water override horizon (top water), as mapped from seismic 2002- 1991 difference data Timelapse signal West of Ihi GWC No change observed in MB-North area Ihi Fault Flank water drive clearly observed into north-west of Maui-B; western aquifer. Water influx in the south of Maui B (contrary to model)
C Sands: Closing the Loop Sept ‘03 model – post 4D updates March ‘02 model – pre 4D updates Actual 4D Amplitude extraction at top C Sands from synthetic seismic difference created from dynamic reservoir model (1991-2002) Amplitude extraction at top C Sands from actual 4D seismic difference (base-monitor EPSI data) Amplitude extraction at top C Sands from synthetic seismic difference created form 4D updated dynamic reservoir model (1991-2002)
Maui background What is 4D? Feasibility study, 4D acquisition & processing 4D interpretation Summary Outline
Project Summary • The Maui 4D seismic project has delivered significant value by: • First 4D application in New Zealand (on a gas field) • Succesfully imaging the vertical GWC movement and lateral movement of flank water override • Highlighting potential areas of low saturation changes • Highlighting where current SFR projects may not be viable, and potentially saving considerable expenditure (MB-North and MB02st)
Additional Value of Maui 4D Seismic • (based on incorporation of the 4D interpretation into the dynamic model) • Constraining dynamic models, reducing uncertainty and improving forecasts. • Optimising production: If we know that water is close to a well, reducing offtake from that well may prevent early water breakthrough, and enable additional volumes to be produced. • Optimising timing of recompletion work: value can be gained in terms of postponed investment. • Allowing, through reduction in reserves uncertainty, optimisation of surface production facilities modifications and general operating and maintenance costs to end of field life.
Maui 4D Team (STOS) Shell Global 4D Team Shell Geophysical Services Maui Joint Venture Partners: Shell Petroleum Mining Company Ltd Todd Petroleum Mining Company Ltd OMV New Zealand Ltd Acknowledgements
Backup slides Maui 4D
Global spread of Shell 4D surveys 22 12 9 3 5 Number of dedicated 4D surveys* on Shell operated assets expected by end 2002* surface and downhole x Benchmarking indicates Shell worldwide 4D implementation leader - from zero in 1999
Synthetics at MA-02 A: Gamma ray, B: Vp, C: Vs, D, Density logs. Black log shows virgin conditions, Red log shows residual gas saturations after Gassmann correction, E: Zero offset trace, F: Pre-stack gather, G: Stack Modelling at well locations • Synthetic modelling results: • Thickness of units:Good reservoir quality units should be resolved when thicker than 6ms • Reservoir Quality:Poor reservoir quality degrades the timelapse signal 7ms 3ms
Introduction to the Maui Field • Maui comprises two low relief structures termed Maui-A & Maui-B • 3 main Eocene, Kapuni Gp reservoir units in each; the C, D & F sands. • Maui produces primarily gas with associated condensate & LPG from the C Sands, with some contribution from the Upper D sands.
No Timelapse difference (Sw unchanged) Timelapse difference (increase in Sw) Key Findings from 4D Data Map of flank water influx from dynamic reservoir model.(Top C Sands amplitude extraction). Amplitude extraction for top of flank water override (top water), as mapped from seismic 2002- 1991 difference data Timelapse signal West of Ihi GWC No change observed in MB-North area Ihi Fault Timelapse signal West of Whitiki. Flank water influx from south and north into Maui A platform is clearly defined Flank water drive clearly observed into north-west of Maui-B; western aquifer. Presence of scarp faults? Water influx in the south of Maui B (contrary to model)