Download
1 / 15
200 likes | 437 Views
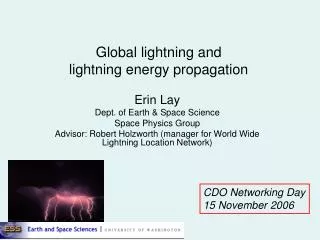
Global Lightning Activity and the Atmospheric Electric Field. Prepared by Marek Gołkowski and Morris Cohen Stanford University and Marek Kubicki Institute of Geophysics (IGF) Polish Academy of Sciences IHY Workshop on Advancing VLF through the Global AWESOME Network. Outline.

E N D
Global Lightning Activity and the Atmospheric Electric Field • Prepared by Marek Gołkowski and Morris Cohen Stanford University and • Marek Kubicki • Institute of Geophysics (IGF) • Polish Academy of Sciences • IHY Workshop on • Advancing VLF through the Global AWESOME Network
Outline • Global Atmospheric Circuit • Stanford-IGF Correlation Study • Atmospheric Electric Field Measurements (Polish Academy of Sciences) • Global Lightning Activity Using VLF (Stanford AWESOME VLF Network) • Results for March and May 2007 • Summary • References
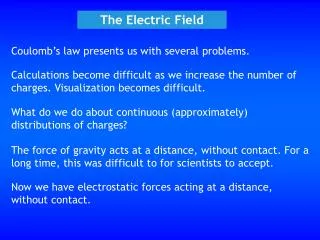
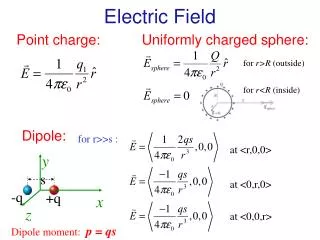
Global Electric Circuit • Global thunderstorms charge ionosphere and current returns to ground through fair weather conduction • Fair weather electric field 100-300 V/m measured on the surface • Circuit looks simple but shows complex variations with latitude, longitude, magnetopheric & ionospheric processes, also pollution and climate change
Global Effects: Carnegie Curve • The Carnegie Curve is daily variation of fair weather electric field with universal time (UT). • Global Lightning Activity and the Carnegie Curve show general correlation • However, several differences remain, most notably, Carnegie Curve does not show a maxima for strong lightning activity in Africa/Europe • Exact role of lightning and other variables still not well understood need for more global measurements Lightning Activity Source: Whipple and Scrase, 1936
America vs. Africa Two hypothesis for the American dominance over Africa in the Carnegie Curve • Current control by position of magnetic dip equator [Kartalev et al., 2006] • Electrified shower curves in South America dominate over Africa [Rycroft et al., 2007 and others]
Lightning activity assessment • Atmospheric electric field • Pros – global measurement • Cons – affected by fair weather conditions • ELF/VLF measurements • Pros – can be measured anywhere, anytime • Cons – affected by ELF/VLF propagation • Measures mostly lightning stroke activity
Stanford - IGF Joint Study • Goal: • Investigate role of global lightning activity on fair weather electric field • Approach: • Lightning releases large amount of energy into VLF band that propagates for long distances • Use VLF data to estimate global lightnting activity • Fair weather electric field (Ez) can be measured with standard scientific equipment • Capture seasonal variation by looking at 2 months: March 2007 and May 2007 VLF Receiver E-Field Collector
Atmospheric Electric Field Measurements HO SW Hornsund - Polish Polar Station Świder Observatory • Atmospheric electricity measurements are made with standard radioactive collectors • The Polish Academy of Sciences operates a mid-latitude collector in Świder, Poland and a polar latitude collector at the Polish Polar Station in Hornsund on Spitsbergen • Measurements were made in “Fair Weather” conditions including low aerosol content confirmed from other instruments
Fair Weather Conditions • Fair Weather Conditions are defined to involve: • No precipitation (rain, snow, hail, fog, etc,) • Minimal clouds < 4/8 (8/8 = complete cloud cover) • Slow wind speed < 6 m/s • No thunderstorms in ~75 km radius from measurement • Additionally it is important to have conditions with small concentrations of aerosols. This concentration can be measured with additional instruments • Only observations made during Fair Weather Conditions are considered to be measurements of the Global Atmospheric Electric Field 9
VLF Measurements Group 1 CH: Chistochina, Alaska PA: Palmer Station, Antarctica AD: Adelaide, Australia Group 2 TA: Taylor, Indiana SW: Swider, Poland MI: Midway Island CH SW TA MI AD PA • For the study global lightning activity was estimated by looking at VLF data from three sites with Stanford Awesome receivers • Sites were chosen to cover all global areas of lightning activity • Total EM energy in a narrow band around 2 frequencies 325 Hz and 10 kHz was calculated every 15 minutes
Day-Night Propagation Effects Palmer (PA) March 5:00 PA 10:00 15:00 • VLF Waves propagate more efficiently at night • Sites show greater activity when station it is nighttime at station • Local time effects need to be taken corrected for in VLF data PA PA
Lightning vs. Ez Atmospheric electric field measurements (bottom panels) observed at SW and HO. Top panel plots show lightning activity derived from sites AD, CH, and PA using the propagation scalar method.
Lightning vs. Ez • ELF/VLF estimate of global lightning activity and atmospheric electric field observed at SW for 25 March 2007 • General similarity is observed on this day
Summary • Fair weather electric field thought to be linked to thunderstorm activity • Strokes? Rainfall? Something else? • Ez field difficult to measure in “fair weather” conditions • ELF/VLF measurements require propagation adjustments • Combination of ELF/VLF and Ez presents complementary measurements • Measurements sometimes correlated, sometimes not. • Why? More analysis to come… • ELF/VLF measurements combined with other instruments can yield exciting new results
References B A. Tinsley, L. Zhou (2006). Initial results of a global circuit model with variable stratospheric and tropospheric aerosol. Journal of Geophysical Research , vol. 11, D16205, doi:10.1029/2005JD006988. Kartalev, M.D., M.J. Rycroft, M. Fuellekrug, V.O. Papitashvili, V.I. Keremidarska ., (2006). A possible explanation for the dominant effect of South American thunderstorms on the Carnegie curve. Journal of Atmospheric and Solar-Terrestrial Physics, 68, 457-468. Rycroft, M.J., Israelsson, S. and Price, C., (2000) The global atmospheric electric circuit, solar activity and climate change. Journal of Atmospheric and Solar-Terrestrial Physics, 62, 1563–1576. Harrison, R. G. (2004), The global atmospheric electric circuit and climate, Surveys in Geophysics, 25, 441-484. Whipple, F.J.W., Scrase, F.J., (1936). Point discharge in the electric field of the earth. Geophysical Memoirs of London VII, 68, 1–20. Williams E.R., S.J Heckman, (1993). The local diurnal variation of cloud electrification and the global diurnal variation of negative charge on the Earth. Journal of Geophysical Research , 98, D3, 5221-5234. Williams, E.R. (1993), Global Circuit response to Seasonal variations in global surface air temperature. Monthly Weather Review, 122,1917-1929. Williams, E. R. G. Satori, (2004). Lighting, thermodynamic and hydrological comparison of the two tropical continental chimneys. Journal of Atmospheric and Solar-Terrestrial Physics, 66, 1213-1231.