Download
1 / 30
300 likes | 453 Views
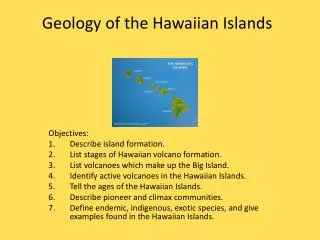
Precipitation Extremes in the Hawaiian Islands under a changing climate. Pao-Shin Chu Ying Chen, Chase Norton, Tom Schroeder Department of Meteorology and Hawaii State Climate Office University of Hawaii-Manoa

E N D
Precipitation Extremes in the Hawaiian Islands under a changing climate Pao-Shin Chu Ying Chen, Chase Norton, Tom Schroeder Department of Meteorology and Hawaii State Climate Office University of Hawaii-Manoa February 29, 2012 (Hawaii Conservation Alliance)
Outline 1.Trends in climate change indices • Projection of future heavy rainfall events for Oahu • Hawaii State Climate Office
Heavy rainfall events are common in Hawaii • The interaction of synoptic systems (cold fronts, kona storms, upper level troughs) with local topography often results in heavy rainfall events that cause damage to properties, agriculture, and public facilities. • Pollutants carried away by stream flows during heavy rainfall events are one of the major threats to marine ecosystems, especially coastal coral reefs.
Heavy rainfall events in the past 8 years • The Halloween flood of 2004 at the UH-Manoa (damage ~$80 million for UH) • The extensive 2006 flood events (The Ka Loko dam on Kauai burst and killed 7 people; the Kahala Mall flooded) • The December 2008 flood on Kauai/Oahu (damage ~$50 million and garnered a federal disaster declaration from the US President) • The December 2010 floods on Oahu/ Hawaii (The Ala Moana Shopping Center was closed because of power outage by excess rainwater)
Drought • Drought in Hawaii has been a recurrent and troublesome problem for the State. Drought reduced crop yields, diminished livestock herds, depleted groundwater supplies, and led to forest and brush fires.
Drought History since 1980 (Hawaii Drought Monitor –DLNR/CWRM) • 1980-81 Hawaii and Maui declared disaster; heavy agri and cattle losses; damages at least $1.4 million • 1983-85 El Niño effect; State declared disaster; crop production reduced by 80% in Waimea and Kamuela areas • 1996 Hawaii, Maui, and Molokai declared drought emergency; losses in agri and cattle industries around $9.4 million • 1998-99 El Niño effect; Hawaii and Maui declared drought emergency; statewide cattle losses estimated at $6.5 million • 2000-2002: Governor proclaims statewide drought emergency; Secretary of Interior designates all counties as primary disaster areas; statewide cattle losses estimated at $9 million
1.Trends in climate changeindices ● Long-term winter (Nov-Mar) rainfall variations in Hawaii from 1905 to 2009; winter is the rainy season ● HRI stands for the Hawaii Rainfall Index (9 stations from each of three islands, Kauai, Oahu, and Hawaii) ● The original rainfall data are standardized (Chu and Chen, 2005)
1. Trends in climate changeindices ●How was the change in precipitation extremes? Will they be similar or different from the total winter rainfall? ● How about changes from one island to another?
Definition of the five climate change indices (WMO/CLIVAR) The first four indices are related to the wetness conditions; CDD defines the duration of excessive dryness.
Precipitation Intensity The overall data set is split into 2 epochs: 1950-79 vs 1980-2007
Peak around 9-11 days; 35-80 CDD occur more often in the last 3 decades (i.e., consecutive dry days near 35-80 days window are happening more often since 1980s)
Used a nonparametric Mann-Kendall method with the Sen’s test (MKS) to investigate trends in precipitation extremes (e.g., precipitation intensity, consecutive dry days). The MKS is robust against outliers and skewed distribution (a robust trend detection method).
trends from the 1950s to 2007, triangles SDII: rainfall intensity Long-term Spatial Features Intensity Intensity Frequency R25: total number of days with daily rainfall ≥ 1 in Downward trends in SDII and R25 for Kauai and Oahu (Rainfall became less intense since 1950) Upward trends in SDII for Big Island (more intense rainfall)
Long-term Spatial Features R5d: consecutive 5 day rainfall totals Magnitude Drought CDD: Consecutive dry days For CDD, overall upward trends. Most islands tend to show longer, consecutive periods of no precipitation days since 1950s.
Summary for Part 1 • Trends of five climate change indicators are examined over the last 60 years. Results reveal a regional pattern. Oahu and Kauai are dominated by long-term downward trends for 4 precipitation related indices, while increasing trends (SDII, R5d, and R95p) are noted over the Big Island (e.g., more intense rainfall, more 5-d rainfall amounts). East-West difference. • Long-term upward trends of drought conditions (CDD) are observed on all the major islands (longer consecutive dry days since 1950s) .
Part 2. Estimating Future Heavy Rainfall Events for Oahu GCM (General Circulation Model) simulates the physical processes of the atmosphere and ocean given initial and boundary conditions
GCM uses mathematics and the law of physics to describe the behavior of the climate– GCM represents the atmosphere and ocean by dividing it up into grid squares. • For GCMs, the horizontal grid spacing is coarse and presents a problem for Hawaii because of the small size of the islands. • Need to “downscale” simulations from GCM for Hawaii. Downscaling is the process for making a link between the large-scale atmospheric circulation and local rainfall.
Statistical downscaling is to find an empirical relation between circulation and local rainfall via statistical methods. • Dynamical downscaling is a method for obtaining high-resolution climate information from coarse resolution GCMs. This is achieved by using a high resolutionregional climate model that is initialized with the output from GCMs. - Computationally demanding
Statistical Downscaling Station Rainfall Data • Stations with at least 30 yrs of daily rainfall data • After some quality control, only 16 stations for Oahu (1979-2008) are used GCM Data • 24 GCMs available (impractical and inefficient) • Evaluate appropriateness of GCMs for use in Hawaii (a baseline test – compare the averaged observed rainfall during 1979-2008 with GCM back projections of the same period, a future projection test – compare each GCM to filter outliers and ranked according to absolute difference from the mean) • These 2 tests are combined to find an overall high ranked model among all 24 GCMs (ECHAM5 A2)
Neural network model (a nonlinear method) because heavy rainfall events (> 90th percentile) may not respond linearly to atmospheric forcings. The advantage is its ability to find maximum relation between predictors and local rainfall. • Four predictors are chosen (low-level wind components, sea level pressure, and relative humidity in the lower atmosphere) • Only seven stations show strong correlations.
Changes in heavy rainfall frequency HIA:47 43 57 ECHAM5 slightly underestimates the frequency of events under the present-day climate; more heavy rainfall events are projected in the future
Changesin heavy rainfall intensity HIA: 797364 mm/day Model shows a dry bias The projected average heavy rainfall intensity is lower than those from the observations and model simulations under the present-day climate.
Summary for Part 2 • A statistical model based on neural networks is used to downscale daily extreme precipitation events in Oahu from GCM outputs and projected into the future. • Increased frequency of heavy precipitation events but a decrease in precipitation intensity for the southern shoreline of Oahu for the next 30 years (2011-2040).
Hawaii State Climate Office (HSCO)hclimate@hawaii.edu • Fully recognized by AASC (American Association of State Climatologists) in 2002 and in partnership with NOAA/NCDC • Serving as an official clearinghouse for climate/weather records in Hawaii and USAPI • Providing climate data to users on a timely basis; users include civil and environmental engineers or planners, insurance companies, government agencies (e.g., DOH, HPD), researchers/students, individuals • Providing current and emerging news to newspapers, TV, and radio • Consulting (e.g., rain storm and flood in January 2002 at Manele Bay on Lanai)
• Drought risk assessment and GIS mapping for the Hawaiian Islands (DLNR funded) • Kona coffee and climate project (NOAA funded) • Providing data to update rainfall-frequency atlas for Hawaii by NOAA (funded by DOH) • Protocol Development for Monitoring Climate for the Pacific Islands (NPS funded) • Updating rainfall station index and atlas (funded by four counties in Hawaii)
References (Chu@hawaii.edu) Chu, 1995: Hawaii rainfall anomalies and El Niño. J. Climate, 8, 1697-1703. Chu/Chen, 2005: Interannual and interdecadal rainfall variations in the Hawaiian Islands. J. Climate, 18, 4796-4813. Chu/Chen/Schroeder, 2010: Changes in precipitation extremes in the Hawaiian Islands in a warming climate. J. Climate, 23, 4881-4900. Norton/Chu/Schroeder, 2011: Projecting changes in future heavy rainfall events for Oahu, Hawaii: A statistical downscaling approach. J. Geophys. Res., 116, D17110.