Download
1 / 35
350 likes | 548 Views
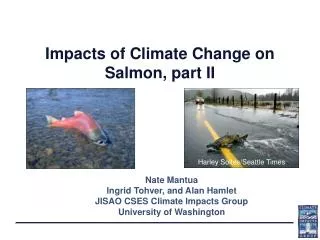
The role of climate change in forecasts of Pacific salmon population dynamics. Mark Scheuerell mark.scheuerell@noaa.gov. DISCLAIMER. The results presented herein are currently "in review" and therefore should not be distributed or cited until further notice.

E N D
The role of climate change in forecasts of Pacific salmon population dynamics Mark Scheuerell mark.scheuerell@noaa.gov In review • Do NOT CITE
DISCLAIMER The results presented herein are currently "in review" and therefore should not be distributed or cited until further notice. If you have any questions, please contact Mark Scheuerell Northwest Fisheries Science Center NOAA Fisheries (206) 302-2437 mark.scheuerell@noaa.gov September 30, 2004 In review • Do NOT CITE
Acknowledgments John Williams (NOAAF) Countless others from NOAAF, USFWS, IDFG, ODFW, WDFW In review • Do NOT CITE
Looking toward the future • Society is faced with an uncertain future from increasing global change • Scientists and policy makers agree that future “success” rests with the capacity to anticipate • Increasingly important as the human population grows • Ecological forecasting represents a step toward predicting ecosystem services using specified uncertainties under future scenarios Clark et al. (2001) Science In review • Do NOT CITE
A caution on forecasting • In Feb 1997, forecasters predicted that the Red River of the North would see flooding greater than anything previously recorded • At Grand Forks, ND forecasters predicted a flood crest of 49 ft. • In April, the river crested at 54 ft. & inundated several cities, causing $2 billion in damages • Local, state, & federal officials cited the inaccuracy of the forecast as the problem • Reality: The forecast was within the long-term 10% error • Bottom line: everyone needs to understand the uncertainty involved Pielke & Conant (2003) Ecology In review • Do NOT CITE
Forecasting in fisheries • It’s done all the time in fisheries management (but not very well) • We often use simple models like stock-recruit relationships • More recent incorporation of more complex mathematics & environmental effects (e.g., Logerwell et al. 2003; Lawson et al. 2004) • Salmon represent a good case study because of their high economic, social, and ecological value (Ruckelshaus et al. 2002) In review • Do NOT CITE
Canada Washington NE Pacific Snake R. Columbia R. Idaho Oregon In review • Do NOT CITE
Spring/Summer Chinook Salmon “Stream type” life history Parr emerge and rear in natal creeks & rivers (year t+1) freshwater Adults return to spawn & die in April-July (year t) Smolts emigrate in April-June (year t+2) Adults at sea (years t+3 to t+5) ocean In review • Do NOT CITE
The slide toward extinction Returning adults (1000s) ESA listing Year In review • Do NOT CITE
Possible reasons for decline • Generally grouped under the “4 H’s” • Harvest • Hatchery operations • Habitat degradation • Hydroelectric (& other) dams • …but there are others too • Exotic species • Climate • Marine-derived nutrients In review • Do NOT CITE
Assessing stock productivity Smolt Adult In review • Do NOT CITE
Smolt-to-adult survival rate (SAR) Count adults returning 1-3 years later Count smolts emigrating past dam In review • Do NOT CITE
Early trends in survival SAR (%) Number of dams In review • Do NOT CITE
It’s the dams, dummy! In review • Do NOT CITE
Recent trends in survival SAR (%) Number of dams In review • Do NOT CITE
Is it really just the dams? In review • Do NOT CITE
PDO The Pacific Decadal Oscillation* A “shot in the arm” for fisheries, oceanography, climatology *Mantua et al. (1997); cited 568 times as of Sept 2004 In review • Do NOT CITE
A dynamic ocean environment • Salmon survival related to climate • PDO (Mantua et al. 1997) • ALPI (Beamish et al. 1997) • AFI (McFarlane et al. 2000) • Upwelling (Botsford & Lawrence 2002) • Various (Logerwell et al. 2003) • Other trophic levels as well • Zooplankton (Brodeur et al. 1999) • Crabs (Zheng & Kruse 2000) • Intertidal inverts (Sagarin et al. 1999) • Seabirds (Jones et al. 2002) In review • Do NOT CITE
Regime shift Regime shift An ocean-climate effect? SAR (%) In review • Do NOT CITE
Canada Washington NE Pacific Snake R. Columbia R. Idaho Oregon In review • Do NOT CITE
The environmental driver Pacific Coastal Upwelling Index (CUI) • Also known as the Bakun Index (Bakun 1990) • Generated monthly by NOAA PFEL based on naval oceanographic data • Spatially referenced at every 3° of lat from 21-60 N • Spring upwelling promotes 1° & 2° production (Pearcy 1992, Brodeur & Ware 1992) • Fall downwelling may decrease advection of important zooplankton prey (Mackas 2001) • Related to salmon survival (Nickelson 1986, Botsford & Lawrence 2002, Logerwell et al. 2003) In review • Do NOT CITE
Narrowing the search • Choosing candidate predictor variables • Exhaustive search over all possible combinations of 12 months is daunting • Chose index from 45N, 48N & 46.25N (interpolated) • Used stepwise multiple regression to choose potential predictor months for time series model • The results • The index from 45N was far superior • reflects early ocean distribution? • April, September & October were significant • transition periods important? In review • Do NOT CITE
Time series of the CUI April September m3 seawater / 100 m shoreline / sec October In review • Do NOT CITE
Time Series Analysis Dynamic Linear Models Observation equation Yt = Xt´qt + vt vt~N[0,Vt] • Recipe for DLMs • Make forecast using information up through previous year • Wait for current-year observation and then update all priors • Repeat steps 1-2 to the end of the time series • Assess overall model performance through Bayes Factors Evolution equation qt = Gtqt-1 + wt wt~N[0,Wt] In review • Do NOT CITE
Dynamic Linear Models A note on information discounting • At each time step, there is a decay of information • This leads to greater uncertainty • Address this through discounting of the Bayesian priors V[qt|Dt-1] = d-1 ·V[qt-1|Dt-1 ] where d Î (0,1] • Choose appropriate d by minimizing NLL of model • When d small, parameters “evolve” quickly, but with decreased precision of the prediction • In practice, 0.99 < d < 0.8 In review • Do NOT CITE
Canada Washington NE Pacific Snake R. SAR Columbia R. CUI Oregon Idaho In review • Do NOT CITE
Forecasting climate-induced survival 6 R2 = 0.71 observed 5 4 model SAR (%) 3 2 1 0 1960 1970 1980 1990 2000 Year of ocean entry In review • Do NOT CITE
The best statistical description 5 R2 = 0.91 observed 4 model 3 SAR (%) 2 1 0 1960 1970 1980 1990 2000 Year of ocean entry In review • Do NOT CITE
Linking all environments In review • Do NOT CITE
Flow (kcfs) Columbia R. flow at The Dalles In review • Do NOT CITE
An early view of the life cycle Adults Eggs Smolts Parr Ocean Freshwater In review • Do NOT CITE
Climate change in the oceans & on land Marine-derived nutrients The 4 H’s Exotic species Adding up the drivers In review • Do NOT CITE
An improved view? Human influence Atmosphere Adults Adults Eggs Smolts Smolts Parr Ocean Freshwater In review • Do NOT CITE
Conclusions • Effective conservation and management requires ecological forecasts • Environmental science has largely failed to produce these • Pacific salmon provide a good case study • We can use simple ocean-climate metrics to predict salmon survival • We need to examine the “big picture” with respect to both life history & environmental processes • It’s time to move forward with an eye on the past In review • Do NOT CITE