Download
1 / 39
430 likes | 1.41k Views
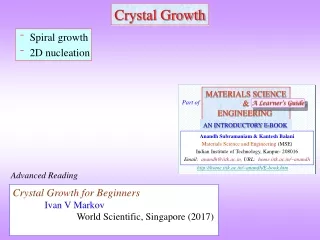
NUCLEATION and CRYSTAL GROWTH. Roger J. Davey, Molecular Materials Centre, UMIST, Manchester, UK. Kinetics. Structure. Thermodynamics. Roj’s Golden Triangle. ‘From molecules to crystallizers’ Roger Davey and John Garside, Oxford Chemistry Primers, OUP, 2000. Supersaturation

E N D
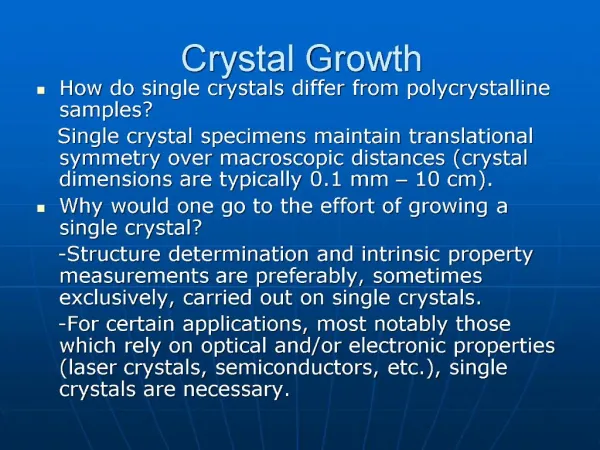
NUCLEATION and CRYSTAL GROWTH. Roger J. Davey, Molecular Materials Centre, UMIST, Manchester, UK.
Kinetics Structure Thermodynamics Roj’s Golden Triangle ‘From molecules to crystallizers’ Roger Davey and John Garside, Oxford Chemistry Primers, OUP, 2000
Supersaturation Nucleation of a crystal Molecular clustering Derivation of a rate equation and its extension to a polymorphic system. Simple experiments – induction times Crystal Growth – a surface sensitive process
supersaturated b c a x Concentration, i metastable c (T) eq undersaturated Temperature, T
Quantifying supersaturation eq = 0 + RTlnxeq ss = 0 + RTlnxss = /RT = ln(xss/xeq)
Some equations (sorry!!) – the critical size or hence define because it follows that Equilibrium between monomers and clusters
(a) Free Energy G 0 zc(b) zc(a) Cluster size, z (b)
20 mJ/m2 10 mJ/m2
Nucleation rate, J crit. Supersaturation,
600 400 Induction time / hr 200 0 0.1 0.2 0.3 Supersaturation Induction times – a simple measure of J.
xi Phase I Solubility xI xB Phase II xII Ti Temperature Nucleation in polymorphic systems
with the two values of B being given by the appropriate values of the term 1632/3R3T 3. Both KJ,I and KJ,II are functions of xeq and T
. By defining the dimensionless variables: a = x / BII1/2, b = (BI / BII) and c = [a / ln (KJ,II /KJ,I)]1/3 a If KJ,I > KJ,II, then above some value of supersaturation, the metastable phase I has the highest nucleation rate whereas below this value phase II appears more rapidly. b If KJ,II > KJ,I and (1 – a/c)3 < b, the stable phase II has the higher nucleation rate at all supersaturations. c If KJ,II > KJ,I and (1 – a/c)3 > b, the metastable phase has the higher nucleation rate only over the intermediate range of supersaturations.
AII AI J AI AII J b a AII AI J c
Time = 15 hrs. Time = 0 hrs. 0.2mm Time = 45 hrs. Time = 30 hrs. Solution chemistry: polymorphic forms of 2,6,dihydroxybenzoic acid
Polymorphs 1 and 2 of 2,6 DHB 1 (Toluene) 2 (Chloroform)
Toluene 1 Chloroform 2
Crystal Growth • Flux of growth units to surface exceeds net loss. • Integration into lattice dependent, amongst others (e.g. molecular recognition) upon strength and number of interactions. • Assume linear growth rate, v, of a face is proportional to total binding energy of growth unit to surface: vK > vS > vF Kinked, stepped and flat faces Growth in direction 1 > 2
Figure 1. The Morphology of glycine taken from Groth5. b = {010}, q = {011}, n = {110}, m = {210}
Sucrose Morphology +C -A -B +B +B +A +C +A -C -A -B Saccharin Morphology
[010] [010] (002) {102} (002) {310} {011} {102} [100] [100] (a) (b) (b) (c) Form 1 Form 2
Crystal growth – the importance of mass transfer, surface integration and temperature. When r = 1 with
Concluding remarks – You cannot define a crystallisation experiment without a phase diagram (solubility curve). In a polymorphic system the relative nucleation rates of different structures are not predictable. In a polymorphic system growth rates of different structures will be different and appearance depends on J.kG A structural model for nucleation based on crystal structure works well – see next lecture. Finally …….. The bees in Roj’s bonnet
Solubility Polymorph I Temperature Solubility (a) Polymorph I Ttransition Polymorph II Polymorph II Temperature (b) Concomitant polymorphs and energies Disappearing polymorphs and control