Download
1 / 15
150 likes | 174 Views
Explore a new threat evaluation method focused on access graph structure, different from traditional packet-based approaches. Discover the correlation between threats and vulnerability for enhanced cybersecurity.

E N D
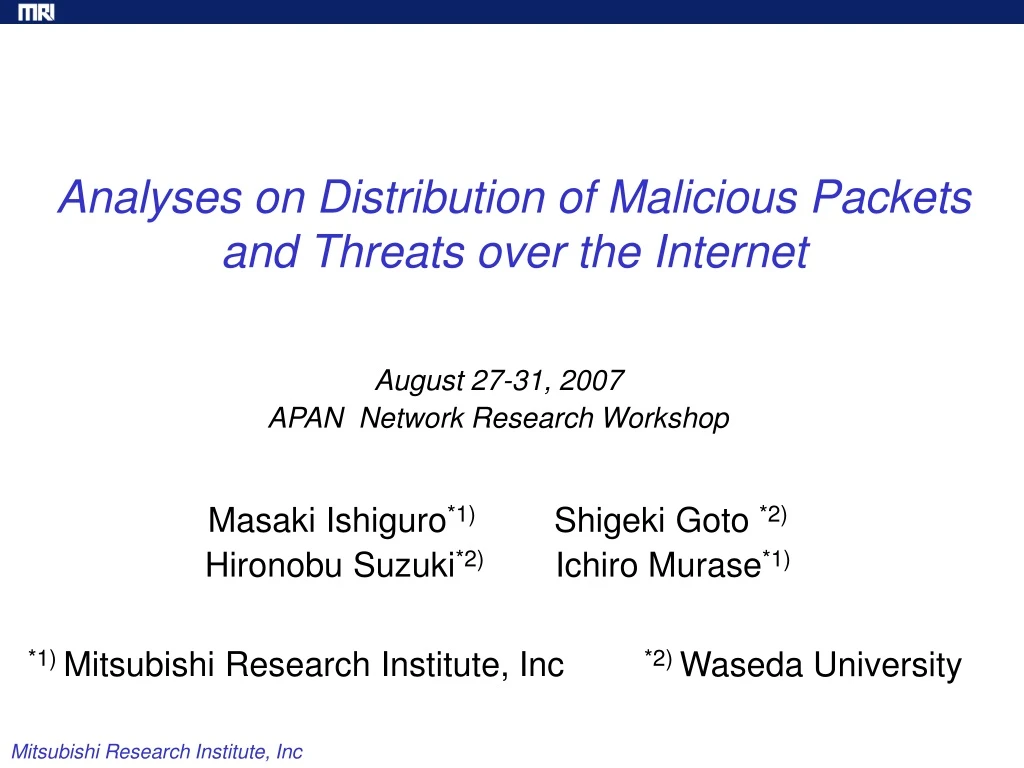
Analyses on Distribution of Malicious Packets and Threats over the Internet August 27-31, 2007 APAN Network Research Workshop Masaki Ishiguro*1)Shigeki Goto *2) Hironobu Suzuki*2) Ichiro Murase*1) *1) Mitsubishi Research Institute, Inc *2) Waseda University
Outline • Introduction • Goal and Motivations • Background history • System overview • A Threat evaluation method • Evaluation approach • Calculation method • Experiment Results • MS SQL Incident • Windows File share Incident • Conclusion and Future work
Our Goal and Motivations • Several internet monitoring systems are deployed. • Find “new” threats without human resources • Threats occur anytime, System never sleeps, running 24 hours/7 days • Find threats from huge amount of data • Access the report in anytime from anywhere http://www.wclscan.org
Background History • 1999 CLSCAN • “pretty print” tool for syslog of my router • 2001, 2 WCLSCAN concept appeared • In a paper “Internet security analysis using packet filter log , SEA software symposium 2001” • Before The Internet Storm Center (2001,3) • 2002 WCLSCAN project was started • Wide area version of clscan • 2003 The early version of WCLSCAN • “threat calculation using Bayesian estimation” unit was added to WCLSCAN • 2004,4 Alert and Information providing with 4 sensor boxes • 2005,9 Official site WWW.WCLSCAN.ORG • 2007, A Threat Evaluation Methods (Today’s Topic)
Our Internet Monitoring System Sensor Encrypted data Sensor SQL Time-Series Access Frequency WCLSCAN Data Server Malicious Packets Sensor ・・・ Graph Analysis Log DB Sensor The Internet Threat Evaluation mn128,may,13,05:40:11,111/tcp mn128,may,13,10:12:55,111/tcp mn128,may,13,10:13:04,111/tcp mn128,may,13,12:35:05,111/tcp mn128,may,13,12:35:05,111/tcp, mn128,may,13,20:25:27,111/tcp, mn128,may,13,20:25:27,111/tcp, mn128,may,13,20:25:30,111/tcp, Threat Levels Graphs
ftp dns Monitored Data
Related Work Spatial Features Analysis Temporal Features Analysis Bayesian Estimation [1] Wavelet Analysis Frequency deviation score Port Correlations Macro-Analysis (Population-based) Auto-Correlation Analysis Source Entropy2] Infection Rate Estimation by Kalman Filter[3] Destination Entropy Anomaly Component analysis Graph Analysis Micro-Analysis (Behavior-based) Destination port sequence mining Frequent Port and IP Extraction
Evolution of Threat Evaluation Approach • Statistical analysis of Malicious Packet Counts • Unique Source IP Address (Infected hosts) • Analysis of Graph Structure • Consideration of vulnerability of destination ports as well as increase of unique source addresses
Example of distribution of source IP addresses Octet 2 Octet 3 Octet 1 Octet 2 Octet 4 Octet 3
Relation between Threats and Vulnerability Relationship 1 Vulnerability of a destination port is higher if it receive packets from many different source addresses with higher threat level. Relationship2 Threat level of a source address is high if it sends more packets to vulnerable destination ports. Threats Vulnerability Sensor IP Addresses: xxx.xxx.xxx.220 Sensor IP Addresses: xxx.xxx.xxx.225 Source IP Address Destination Ports(IP’s×ports)
Threat Calculation Method Threat Vector (source) W: weight matrix Vulnerability Vector (dest.) Relationship 1 Relationship2 Eigenvalue Equations
Conclusion and Future Works • We proposed a new threat evaluation method based on structure of access graph which are quite different from traditional methods based on the number of malicious packets. • We demonstrated examples that our method responds better than the number of malicious packets Future Works: • Optimization of edge weights of access graph • Optimization of Unit time of our graph analysis • Evaluation of Strength and weakness of our method depending on the types of incidents
WCLSCAN OFFICIAL SITE WWW.WCLSCAN.ORG