Download
1 / 1
10 likes | 76 Views
Characterisation of immune infiltrates in malignant and benign prostate tissues. No. 122. D.T.S. Woon 1,2 , G. Whitty 1 , M. Saxena 1 , D.M. Bolton 1,2 , I. D. Davis 1,3 1 Ludwig Institute for Cancer Research Uro -oncology Laboratory 2 Urology, Austin Health, Heidelberg, VIC, Australia

E N D
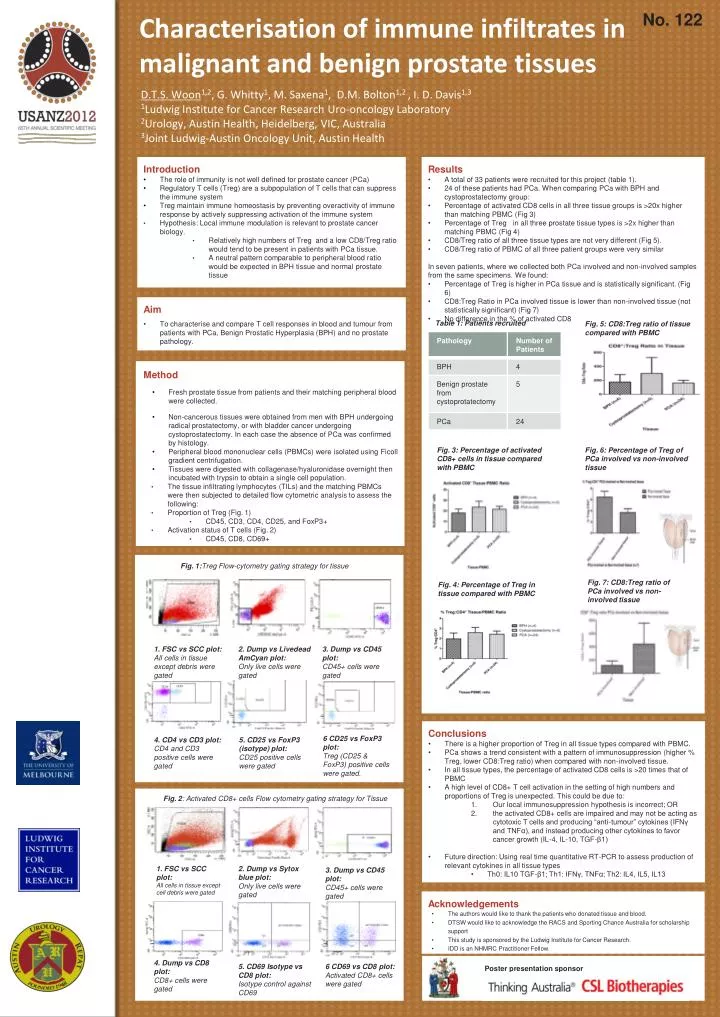
Characterisation of immune infiltrates in malignant and benign prostate tissues No. 122 D.T.S. Woon1,2, G. Whitty1, M. Saxena1, D.M. Bolton1,2 , I. D. Davis1,3 1Ludwig Institute for Cancer Research Uro-oncology Laboratory 2Urology, Austin Health, Heidelberg, VIC, Australia 3Joint Ludwig-Austin Oncology Unit, Austin Health • Introduction • The role of immunity is not well defined for prostate cancer (PCa) • Regulatory T cells (Treg) are a subpopulation of T cells that can suppress the immune system • Treg maintain immune homeostasis by preventing overactivity of immune response by actively suppressing activation of the immune system • Hypothesis: Local immune modulation is relevant to prostate cancer biology. • Relatively high numbers of Treg and a low CD8/Treg ratio would tend to be present in patients with PCatissue. • A neutral pattern comparable to peripheral blood ratio would be expected in BPH tissue and normal prostate tissue • Results • A total of 33 patients were recruited for this project (table 1). • 24 of these patients had PCa. When comparing PCa with BPH and cystoprostatectomy group: • Percentage of activated CD8 cells in all three tissue groups is >20x higher than matching PBMC (Fig 3) • Percentage of Tregn in all three prostate tissue types is >2x higher than matching PBMC (Fig 4) • CD8/Treg ratio of all three tissue types are not very different (Fig 5). • CD8/Treg ratio of PBMC of all three patient groups were very similar • In seven patients, where we collected both PCa involved and non-involved samples from the same specimens. We found: • Percentage of Treg is higher in PCa tissue and is statistically significant. (Fig 6) • CD8:Treg Ratio in PCa involved tissue is lower than non-involved tissue (not statistically significant) (Fig 7) • No difference in the % of activated CD8 • Aim • To characterise and compare T cell responses in blood and tumour from patients with PCa, Benign Prostatic Hyperplasia (BPH) and no prostate pathology. • Method • Fresh prostate tissue from patients and their matching peripheral blood were collected. • Non-cancerous tissues were obtained from men with BPH undergoing radical prostatectomy, or with bladder cancer undergoing cystoprostatectomy. In each case the absence of PCa was confirmed by histology. • Peripheral blood mononuclear cells (PBMCs) were isolated using Ficoll gradient centrifugation. • Tissues were digested with collagenase/hyaluronidase overnight then incubated with trypsin to obtain a single cell population. • The tissue infiltrating lymphocytes (TILs) and the matching PBMCs were then subjected to detailed flow cytometric analysis to assess the following: • Proportion of Treg (Fig. 1) • CD45, CD3, CD4, CD25, and FoxP3+ • Activation status of T cells (Fig. 2) • CD45, CD8, CD69+ Table 1: Patients recruited Fig. 5: CD8:Treg ratio of tissue compared with PBMC Fig. 3: Percentage of activated CD8+ cells in tissue compared with PBMC Fig. 6: Percentage of Treg of PCa involved vs non-involved tissue Fig. 1:Treg Flow-cytometry gating strategy for tissue Fig. 7: CD8:Treg ratio of PCa involved vs non-involved tissue Fig. 4: Percentage of Treg in tissue compared with PBMC 1. FSC vs SCC plot: All cells in tissue except debris were gated 3. Dump vs CD45 plot: CD45+ cells were gated 2. Dump vsLivedeadAmCyan plot: Only live cells were gated • Conclusions • There is a higher proportion of Treg in all tissue types compared with PBMC. • PCa shows a trend consistent with a pattern of immunosuppression (higher % Treg, lower CD8:Treg ratio) when compared with non-involved tissue. • In all tissue types, the percentage of activated CD8 cells is >20 times that of PBMC • A high level of CD8+ T cell activation in the setting of high numbers and proportions of Treg is unexpected. This could be due to: • Our local immunosuppression hypothesis is incorrect; OR • the activated CD8+ cells are impaired and may not be acting as cytotoxic T cells and producing “anti-tumour” cytokines (IFNγ and TNFα), and instead producing other cytokines to favor cancer growth (IL-4, IL-10, TGF-β1) • Future direction: Using real time quantitative RT-PCR to assess production of relevant cytokines in all tissue types • Th0: IL10 TGF-β1; Th1: IFNγ, TNFα; Th2: IL4, IL5, IL13 6 CD25 vs FoxP3 plot: Treg (CD25 & FoxP3) positive cells were gated. 4. CD4 vs CD3 plot: CD4 and CD3 positive cells were gated 5. CD25 vs FoxP3 (isotype) plot: CD25 positive cells were gated Fig. 2: Activated CD8+ cells Flow cytometry gating strategy for Tissue 2. Dump vsSytox blue plot: Only live cells were gated 1. FSC vs SCC plot: All cells in tissue except cell debris were gated 3. Dump vs CD45 plot: CD45+ cells were gated • Acknowledgements • The authors would like to thank the patients who donated tissue and blood. • DTSW would like to acknowledge the RACS and Sporting Chance Australia for scholarship support • This study is sponsored by the Ludwig Institute for Cancer Research. • IDD is an NHMRC Practitioner Fellow. 4. Dump vs CD8 plot: CD8+ cells were gated 6 CD69 vs CD8 plot: Activated CD8+ cells were gated 5. CD69 Isotypevs CD8 plot: Isotype control against CD69 Poster presentation sponsor