Download
1 / 33
330 likes | 456 Views
Success Factors Leading to Bachelor D egree C ompletion. James M. Ritter, Ph.D. Director, Enrollment Management & Student Services Kent State University at Trumbull. What does it matter?.

E N D
Success Factors Leading to Bachelor Degree Completion James M. Ritter, Ph.D. Director, Enrollment Management & Student Services Kent State University at Trumbull
What does it matter? • At the beginning of the century, college graduates earned 90% more than their high school graduate counterparts • College graduates are healthier, live longer and, in general, are happier than non-college graduates
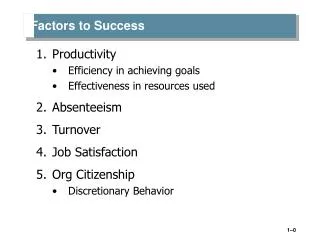
We Know the Success Factors • Student Motivation • Academic Preparation
The Toolbox Revisited 95% of students who completed the following by 1992 obtained a bachelors degree by 2000: 3.75 or more Carnegie units of English 3.75 or more Carnegie units of mathematics - highest mathematics of either calculus, precalculus, or trigonometry* 2.5 or more Carnegie units of science or more than 2.0 Carnegie units of core laboratory science (biology, chemistry, and physics) more than 2.0 Carnegie Units of foreign languages more than 2.0 Carnegie Units of history and social studies 1.0 or more Carnegie Units of computer science more than one Advanced Placement course no remedial English; no remedial mathematics *Algebra II is the lowest math a student a student can take and realistically expect to graduate from college.
Reality • All high schools do not offer such opportunities • Some groups do not take advantage of the opportunities: • Latino studentsare less likely than White or Asian students to attend a school that offers trigonometry or above • Students from the lowest socioeconomic status are less likely to attend a school that offers any math above Algebra 2 • Even if the school has changed since the data was reported, most colleges today have a large number of non-traditional students who attended when a less quality curriculum was offered
Reality (continued) • Other factors include: • Gender • Race/ethnicity • Socio-economic status • Reading ability • Parental involvement • Course intensiveness • Extra-curricular activities
Reality (continued) • “Today’s high school students who expect to attend college are less well prepared academically than were their predecessors. They are also less likely to meet their educational goals, fueling suspicion that the first trend drives the second.” • Guidance counselors used to be the gatekeepers of higher education. However, now they are encouraging almost all students to, at least, give college the “college try”.
What about college? • Students who do not complete, at least, 20 credits during their freshman year are at a distinct disadvantage of ever obtaining a bachelor’s degree • Approximately 90% of traditional age (coming right out of high school) students who drop out of college do so some time during their second year • In addition, the longer a student waits to attend college after high school, the less likely they are to graduate with a bachelor’s degree • Continuous enrollment (not stopping out for more than one semester, excluding summer) increased the likelihood of graduating with a bachelor’s degree by 43%
Transferring • Students who transferred from a community college or from one four-year institution to another had a much greater chance of graduating with a bachelor’s degree than students who had more than one transfer.
Withdrawals • Students who withdrew from, or repeated, 20% or more of their courses are 50% less likely to graduate with a bachelor’s degree. • It’s all about MOMENTUM!!
Room for Improvement • In the last ten years, bachelor degree graduation rates have declined • Only one-third of traditional age students completed a bachelors degree in four years from the school in which they started • Between 54% – 58% completed a bachelors degree in six years from the school in which they started • Between 62% and 67% completed a bachelors degree in six years from a different school in which they started • This means, at best, one-third of students are out of school with many owing a substantial amount of money in loans but no degree
The Results • 63.4% of first time students who started college in 2007 had completed a degree within six years • Only 50.6% of students who started in 2007 completed a degree within six years at the institution at which they began • A study by Chen and Carroll (2005) showed that only 24% of first generation college students obtained a bachelor’s degree within 8 years (this increased to 47% when looking at first generation students with bachelor degree aspirations who started at a four-year institution) • This is worse than any other country, except Hungary
Opposite Extremes • Students from rural areas are more likely than students from urban areas to attend public, as well as, and nonselective institutions • The more selective the institution, the higher the probability of graduating • First generation students had lower “educational aspirations” than their second generation peers • Approximately 25% of freshmen from the bottom 50% of household incomes graduate in six years • Almost 90% of freshman from the top 25% of household incomes complete a bachelor’s degree
Three Key Factors • Academic Integration • Social Integration • Institutional Commitment
What is Academic Integration? • Academic Integration • Make students feel “at home” • Encourage them to partake in student activities • Connect students with faculty and staff • Learning Communities
What is Social Integration? • Integrating students into the social realm of a college or university • Pre-attendance social integration • Involve students in a social media (i.e. Facebook) format to discuss one or more courses
What is Institutional Commitment? • The degree to which an individual plans to stay at one particular institution • Students confirm their decision to stay or leave an institution within the first six weeks of their first term
National Center of Student Engagement (NSSE) • Five areas of “effective educational practice” • Level of academic challenge • Active and collaborative learning • Student interaction with faculty • Enriching educational experiences • Supportive campus environment
Level of Academic Challenge • Institutions must create “challenging intellectual and creative work” • Make students use higher order thinking skills • Make students work harder than previously thought in order to meet an instructor’s standards • Create an environment that emphasizes studying and academic work
Active and Collaborative Learning • Students must be intensely involved in the content, collaborate with other students, and be able to apply the material learned • Participate in class discussions • Make presentations in class • Work with other students on projects • Work with other students outside of class • Tutor other students • Be active in community-based projects • Discuss ideas from readings or classes with other students
Student Interaction with Faculty • The greater the interaction with faculty, the greater the student experience • Discussing career plans • Talking about ideas from the readings before/after class • Working with faculty on research projects • Working with faculty in areas other than coursework (i.e. student life activities)
Enriching Educational Experiences • Numerous, diverse opportunities to complement in-class learning • Conversing with students from different economic, social, and racial/ethnic backgrounds • Internships, co-ops or field experiences • Community service • Study abroad • Co-curricular activities • A culminating senior experience
Supportive Campus Environment • Students perform better at colleges that work to create positive relationships with different campus groups • Assist students with non-academic issues • Promote good relationships between students and • Peers • Faculty • Administrators and staff
Case Study – University of Texas • “Adversity indicators” (at least two) • Lower SAT scores (200 points lower) • Low income families • Less educated parents
Case Study – University of Texas (continued) • Special conditions • Smaller class (50 students versus 200 students) • Supplemental Instruction (2 hours each week) • Advisors who kept in close contact and intervened when students fell behind • Upperclassmen worked with students one-on-one • Convinced the students they were high achievers, not lower-level students (i.e. placed into developmental courses)
Case Study – University of Texas (continued) • The results • Students in the smaller section received the same grades as those in the larger section • Above-average (for the University) retention rate (freshman to sophomore year) • Three years later, their graduation rate was higher than the University • David Laude was promoted from Associate Professor to Senior Vice President for Enrollment & Graduation Management
So What Can You Do? • Encourage college attendance right after high school • Encourage completion of 20-30 credit hours per year • Discourage withdrawals • Advising • Institutional policy against “no penalty withdrawals” • Encourage summer attendance • Be selective (i.e. programs)
So What Can You Do? (continued) • Identify at-risk students • Rural versus urban • First generation • Household income • Reach out to at-risk students
So What Can You Do? (continued) • Support all efforts for academic and social integration as well as institutional commitment • Welcome students • Student activities • Social media • Internships • Community service • Physical spaces to study
So What Can You Do? (continued) • Supplemental Instruction
References Alexander, Karl; Bozick, Robert; Entwisle, Doris. Warming up, cooling out, or holding steady? Persistence and change in educational expectations after high school. Sociology of Education. Oct 2008, Vol. 81 Issue 4, p371-396. Chen & Carroll (2005) in Woosley, S. & Shepler D. (2011) Understanding the early integration experiences of first-generation college students. College Student Journal, 45(4), 700- 714. Davidson, J. (2014). Leading indicators: Increasing statewide bachelor’s degree completion rates at 4-Year public institutions. Higher Education Policy, (27), 85-109. Dundar, A., & Shapiro, D. (2013) Completing College: A National View of Student Attainment Rates – Fall 2007 Cohort, National Student Clearinghouse. Gibbs, R. M. (1998). College completion and return migration among rural youth. In R. M. Gibbs, P. L. Swaim, & R. Teixeira (Eds.), Rural education and training in the new economy: The myth of the rural skills gap (pp. 61–80). Ames: Iowa State University Press. Ribchester, C., Wakefield, K., & Miller, G. (2012). Creating a transitional space for new students through pre-induction social networking. Journal of Geography of Higher Education, 36 (3), 455-467. Severiens, S., & Schmidt, H. (). Academic and social integration and study progress in problem based learning, Higher Education, 58, 59 – 69. Torche, F. (2011). Is a college degree still the great equalizer? Intergenerational mobility across levels of schooling in the United States.American Journal of Sociology, 117(3), 763–807. Terenzini, P. T., Springer, L., Yaeger, P. M., Pascarella, E. T., & Nora, A. (1996). First generation college students: Characteristics, experiences, and cognitive development. Research in Higher Education, 37, 1–22. Tinto, V. (1997). Universities as learning organizations. About Campus, 2-4. Tough, P. (2014, May 18). Who gets to graduate? Retrieved from http://www.nytimes.com/2014/05/18/magazine/who-gets-to-graduate.html?emc=eta1&_r=0. Trusty, J. & Niles, S.G. (2004). Realized potential or lost talent: High school variables and bachelor’s degree completion. The Career Development Quarterly, 53, 2-15. Woosley, S. A., & Miller, A. L. (2009). Integration and institutional commitment as predictors of college student transition: Are third week indicators significant? College Student Journal, 43 (4), 1260 – 1271.