How Winds are Created
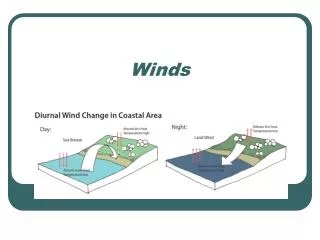
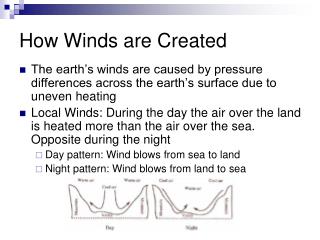
How Winds are Created. The earth’s winds are caused by pressure differences across the earth’s surface due to uneven heating Local Winds: During the day the air over the land is heated more than the air over the sea. Opposite during the night Day pattern: Wind blows from sea to land

How Winds are Created
E N D
Presentation Transcript
How Winds are Created • The earth’s winds are caused by pressure differences across the earth’s surface due to uneven heating • Local Winds: During the day the air over the land is heated more than the air over the sea. Opposite during the night • Day pattern: Wind blows from sea to land • Night pattern: Wind blows from land to sea
How Winds are created • Global Winds: Occur due to greater heating of the air near the equator than the poles. Thus wind blows in the direction from the poles to the equator • Large ocean and land masses also affect the wind pattern • It is important to understand these wind patterns for the evaluation of potential wind sites
Classes of Wind Power Density at 10 m and 50 m(a) . 10 m (33 ft) 50 m (164 ft) WindPower Class Wind PowerDensity (W/m2) Speed(b)m/s (mph) Wind PowerDensity (W/m2) Speed(b)m/s (mph) 1 <100 <4.4 (9.8) <200 <5.6 (12.5) 2 100 - 150 4.4 (9.8)/5.1 (11.5) 200 - 300 5.6 (12.5)/6.4 (14.3) 3 150 - 200 5.1 (11.5)/5.6 (12.5) 300 - 400 6.4 (14.3)/7.0 (15.7) 4 200 - 250 5.6 (12.5)/6.0 (13.4) 400 - 500 7.0 (15.7)/7.5 (16.8) 5 250 - 300 6.0 (13.4)/6.4 (14.3) 500 - 600 7.5 (16.8)/8.0 (17.9) 6 300 - 400 6.4 (14.3)/7.0 (15.7) 600 - 800 8.0 (17.9)/8.8 (19.7) 7 >400 >7.0 (15.7) >800 >8.8 (19.7)
Modern Wind Turbine Wind power systems are composed of: • Tower • Rotor with 2 or 3 blades (fiberglass reinforced plastics, epoxy laminates • Yaw Mechanism such as a tail vane • Low-speed shaft, high-speed shaft, and gearbox (Mechanical Drive Train) • Electrical generator • Speed sensors and control Modern wind power systems also include: • Power electronics • Control electronics • Batteries to improve the load availability when in stand-alone mode • Transmission link connecting to the area grid
Characteristic of Wind Turbines • Variations in wind speed causes fluctuations in the amount of power produced • Short Term: Gusts and Turbulence • Long Term: Seasonal Changes • WTs have a cut-in, cut-out and a peak power output for a given wind velocity • Power from the wind is proportional to the area swept by the rotors • In practice, the max power efficiency is 45%
Wind Power Source: GWEC (Global Wind Energy Council) 2008: http://www.gwec.net/fileadmin/documents/PressReleases/PR_stats_annex_table_2nd_feb_final_final.pdf
Wind Power Source: GWEC (Global Wind Energy Council) 2008: http://www.gwec.net/fileadmin/documents/PressReleases/PR_stats_annex_table_2nd_feb_final_final.pdf
Top 10 total installed capacity Top 10 added capacity (2008) Source: GWEC (Global Wind Energy Council) 2008: http://www.gwec.net/fileadmin/documents/PressReleases/PR_stats_annex_table_2nd_feb_final_final.pdf
Cost Analysis • Wind energy generation costs have dramatically decreased over the last 25 years from 40 cents/KWh to 4 cents/KWh • 20 years from now wind energy is expected to be cheaper than conventional sources of energy
Advantages and Disadvantages of Wind Turbines • Advantages • Clean Source of Energy • Unlimited Supply • Popular with the Public • Disadvantages • How do wind plants impact the power system grid (Not enough data) • Very expensive to install and connect to the power grid
Wind Turbine Power: • P = 0.5 x rho x A x Cp x V3 x Ng x Nb • P = power in watts (746 watts = 1 hp) • rho = air density (about 1.225 kg/m3 at sea level, less higher up)A = rotor swept area, exposed to the wind (m2)Cp = Coefficient of performance (.59 {Betz limit} is the maximum theoretically possible, .35 for a good design) V = wind speed in meters/sec (20 mph = 9 m/s)Ng = generator efficiency (50% for car alternator, 80% or possibly more for a permanent magnet generator or grid-connected induction generator)Nb = gearbox/bearings efficiency (depends, could be as high as 95% if good)
Wind Turbine Noise Levels
Electricity Demand Varies throughout the Day Natural Gas Total Coal Capacity Nuclear Coal Source: ERCOT Reliability/Resource Update 2006
Wind and ERCOT daily load Source: Dispatchable Hybrid Wind/Solar Power Plant, Mark Kapner, P.E
ERCOT load duration curve 2007 Source: Dispatchable Hybrid Wind/Solar Power Plant, Mark Kapner, P.E
Average hourly wind speed Jan.-Nov. 2008 Source: West Texas A &M University http://www.windenergy.org/datasites/1405-olfen/index.html
GOAL FOR RENEWABLE ENERGY October 15, 2008 24 Statutory goal adopted in 1999, revised in 2005 33 mw biomass; 69 mw landfill gas; 33 mw hydro; 1 mw solar
CREZ SCENARIOS October 15, 2008 25
SCENARIO 2 TRANSMISSION PLAN October 15, 2008 • 1,705 miles of new 345-kV double circuits • 453 miles of new 345-kV single circuit • 371 miles of 345-kV rebuild & upgrade $4.9 billion cost, not including interconnection facilities 26
WHAT’S AHEAD FOR ERCOT WIND DEVELOPMENT September 10, 2008 27 • Concern about over-development of West Texas wind • Development beyond CREZ plan could reduce market value of all West Texas wind production • In next few years, congestion between West Texas and population centers will be significant • ERCOT transition to nodal market has been delayed • Concerns about reliability with high levels of wind • Forecasting wind, adequate thermal generation to match swings in load and wind generation, cost of load-following services