Comparative Analysis of Gene Regulation in Hypoxia vs. Normoxia via Illumina 450k Microarray
10 likes | 130 Views
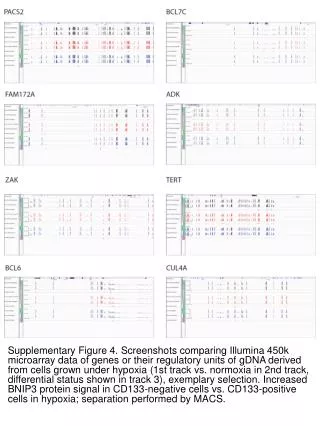
This figure presents a comprehensive comparison of gene expression and regulatory units derived from gDNA samples of cells grown under hypoxic versus normoxic conditions. The first track displays the hypoxic data, while the second track shows normoxic conditions, with the differential expression highlighted in the third track. A notable example is the increased BNIP3 protein signal observed in CD133-negative cells compared to CD133-positive cells during hypoxia, with sample separation achieved using MACS technology.

Comparative Analysis of Gene Regulation in Hypoxia vs. Normoxia via Illumina 450k Microarray
E N D
Presentation Transcript
Supplementary Figure 4. Screenshots comparing Illumina 450k microarray data of genes or their regulatory units of gDNA derived from cells grown under hypoxia (1st track vs. normoxia in 2nd track, differential status shown in track 3), exemplary selection. Increased BNIP3 protein signal in CD133-negative cells vs. CD133-positive cells in hypoxia; separation performed by MACS.