
Excess Cluster X-Ray Point Sources - Analyzing AGN in Galaxy Clusters
Investigating X-ray point sources in galaxy clusters to identify and study AGN using optical and spectroscopic data analysis.

Excess Cluster X-Ray Point Sources - Analyzing AGN in Galaxy Clusters
E N D
Presentation Transcript
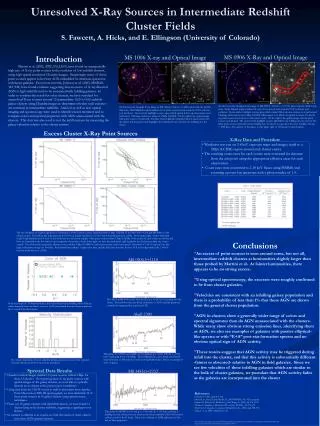
MS 1006 X-ray and Optical Image MS 0906 X-Ray and Optical Image On the Left is the Chandra X-ray image of MS 0906.5+1110 at z = 0.1709, taken with the ACIS-I chip array. Small elliptical regions indicate X-ray point sources found using the CIAO software tool, wavdetect. Green circles highlight sources upon which optical follow up observations were performed. The large circle denotes the 2 Mpc (LCDM) radius region over which we applied wavdetect to find X-ray point sources in proximity to the cluster center. On the right is the optical image with the point sources over plotted. The green circles highlight sources identified to be infalling into the cluster. The three point sources circled in red are infalling into the cluster as a group at the same redshift, with Δv ≈ 1800 km/s. The spectra of the galaxy on the upper right of this group is plotted below. On the left is the Chandra X-ray image of MS 1006.0+1202 at z=0.2605, taken with the ACIS-I chip array. Small elliptical regions indicate X-ray point sources found using the CIAO software tool wavdetect. Green circles highlight sources upon which optical follow up observations were performed. The large circle has a radius of 2 Mpc (LCDM). On the right is the optical image with point sources over plotted. The blue circles highlight identified objects unassociated with the cluster and the green circle highlights the identified source found to be infalling into the cluster. Excess Cluster X-Ray Point Sources X-Ray Data and Procedure Wavdetect was run on 2-8 keV exposure maps and images, sized to a 2Mpc (LCDM) region around each cluster center. The resulting count rates for each source were corrected for distance from the aim point using the appropriate effective areas for each observation. Count rates were converted to 2-10 keV fluxes using PIMMS, and assuming a power law spectrum with a photon index of 1.4. The two left plots are LogN-LogS plots of hard band (2-10 keV) point sources identified within 2 Mpc (LCDM) of the MS 1006.0+1202 and MS 0906.5+1110 cluster centers. The dashed line represents the best fit X-ray background in the 2-10 keV band from Moretti et al. (2003). In the upper right, we plot individual LogN-LogS distributions for each of the 10 clusters in our current sample. Only point sources within 2 Mpc (LCDM) of the center of each cluster are shown, and lines are truncated at the flux limit of each respective observation. In the lower right, we have the combined LogN-LogS plot for all clusters within our current sample. The solid red line represents all point sources within 2 Mpc (LCDM) of each cluster center, and is truncated at a flux limit of 1.8e-15 erg/cm2/sec (the highest flux limit among our 10 fields). Red dashed lines indicate 1 sigma error bars, and the black line describes the best fit X-ray background in the 2-10 keV band from Moretti et al. (2003). MS 0906.5+1110 Hδ Hγ This AGN in MS 0906 is very blue in color, g-r =0.25, but is infalling into the cluster. The emission lines are broad, indication of AGN, and the spectrum contains the signature blue emission, [OII]. From the sample of 35 identified objects, the objects identified as infalling cluster AGN are widely dispersed from very blue to very red. AGN unassociated from the cluster population show a trend in the bluer region. Abell 2390 Hγ Hδ K H This galaxy in A2390 is an example of a red galaxy, g-r = 0.60, with Δv ≈ -3194 km/s, indicating that it is infalling. This red galaxy has a clear break at CaII with clear indication of Hδ and Hγ as well as strong Balmer lines. This is an example of an E+A galaxy. The velocity dispersion of the 11 identified infalling galaxies does not fit the expected Gaussian velocity distribution for a cluster population. Spectral Data Results MS 1455.0+2232 Chandra archival images yielded 113 point sources within 2 Mpc for these 12 clusters. Over plotting these X-ray point sources with optical images of the galaxy clusters, we were able to optically identify most objects at the point source coordinates. Using data from the CNOC survey as well as data taken from Apache Point Observatory DIS III spectrograph, we have identified 35 of these point sources in 10 galaxy clusters using spectroscopic techniques. From our 10 galaxy clusters with identified objects, we have found 11 objects lying at the cluster redshifts, suggesting a significant over- density. In contrast to Martini et al. results, we find that many of these objects have clear AGN spectral features. References: Gehrels, N. 1986, ApJ. 303, 336 Johnson, O., Best, P. and Almani, O., 2003 MNRAS, 343, 924, accepted Martini, P., Kelson, D., Mulchaey, J., and Trager, S., 2002, AJ, 576, L109 Molnar, S., Hughes, J., Donahue, M., and Joy, M.,2002, AJ, 573, L91 Moretti, A., Campana, S., Lazzati, D.,Tagliaferri, G., 2003, ApJ, 588, 696 Yang, Y. et al., 2004, submitted to AJ Hγ G band K H This galaxy in MS1455 is very red, g-r = 0.90, with Δv ≈ 291 km/s, placing it infalling into the cluster, but very nearly at the cluster redshift. The H+K break is evident as well as the G-band. There is no evidence of [OII], indication of the lack of blue properties. This research was supported by a NASA Graduate Student Program award, a University of Colorado Undergraduate Research Opportunities Fellowship and Chandra program GO0-1079X. Introduction Martini et al. (2002, APJL,576,L109), have found an unexpectedly high rate of X-ray point sources in the outskirts of low-redshift clusters, using high spatial resolution Chandra images. Surprisingly, many of these point sources appear to be from AGN embedded in otherwise quiescent, red cluster galaxies. Even more recently, Johnson et al. (2003, MNRAS, 343, 924) have found evidence suggesting that an excess of X-ray detected AGN at high redshift seem to be associated with infalling galaxies. In order to confirm this result for other clusters, we have searched for unresolved X-ray sources around 12 intermediate (0.2<z<0.6) redshift galaxy clusters using Chandra images to determine whether such excesses are common at intermediate redshifts. Archival as well as new optical imaging and spectroscopy were used to identify cluster members and to compare colors and spectral properties with AGN unassociated with the clusters. This data was also used to test the infall scenario by measuring the galaxy velocities relative to the cluster centers. Unresolved X-Ray Sources in Intermediate Redshift Cluster FieldsS. Fawcett, A. Hicks, and E. Ellingson (University of Colorado) Conclusions • An excess of point sources is seen around some, but not all, intermediate redshift clusters at luminosities slightly larger than those probed by Martini et al. At fainter luminosities, there appears to be no strong excess. • Using optical spectroscopy, the excesses were roughly confirmed to be from cluster galaxies. • Velocities are consistent with an infalling galaxy population and there is a probability of less than 1% that these AGN are drawn from the general cluster population. • AGN in clusters show a generally wider range of colors and spectral signatures than do AGN unassociated with the clusters. While many show obvious strong emission lines, identifying them as AGN, we also see examples of galaxies with passive elliptical-like spectra or with “E+A” post-star formation spectra and no obvious optical sign of AGN activity. • These results suggest that AGN activity may be triggered during infall into the cluster, and that this activity is substantially different -fainter or obscured- relative to AGN in field galaxies. Since we see few velocities of these infalling galaxies which are similar to the bulk of cluster galaxies, we postulate that AGN activity fades as the galaxies are incorporated into the cluster


