1. INTRODUCTION
10 likes | 187 Views
1 School of Geography, University of Leeds, Leeds, UK; 2 Department of Earth and Environmental Sciences, CEPSAR, The Open University, UK; 3 Instituto de Investigaciones de la Amazonia Peruana (IIAP), Peru; 4 Department of Biology, University of Turku, Finland. 5. STUDY SITES.

1. INTRODUCTION
E N D
Presentation Transcript
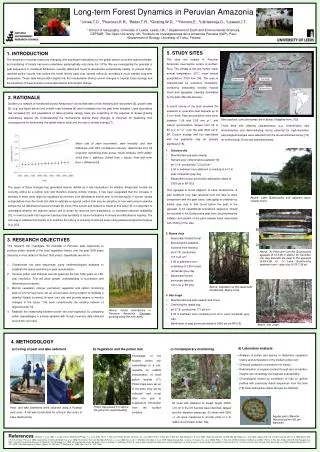
1 School of Geography, University of Leeds, Leeds, UK; 2 Department of Earth and Environmental Sciences, CEPSAR, The Open University, UK; 3Instituto de Investigaciones de la Amazonia Peruana (IIAP), Peru; 4Department of Biology, University of Turku, Finland 5. STUDY SITES The sites are located in Peruvian Amazonia, near Iquitos, Loreto, in northern Peru. The climate is hot and humid: mean annual temperature: 26˚C; mean annual precipitation: 3100 mm [14]. The area is characterised by extensive floodplains, containing seasonally flooded tropical forest and aguajales: swamps dominated by the palm Mauritia flexuosa. A recent survey of the area revealed the presence of extensive peat deposits up to 5.9 m thick. Peat accumulation rates were between 1.69 and 2.56 mm yr-1, and carbon accumulation ranged from 39 to 85 g C m-2 yr-1 over the past 3000 cal yr BP. Carbon storage and flux associated with the peatlands may be globally significant [15]. 2. RATIONALE Studies of a network of forest plots across Amazonia [1] show that rates of tree mortality and recruitment [2], growth rates [3] (e.g. see figure below) and overall forest biomass [4] have increased over the past three decades. Liana abundance has increased [5], and populations of faster-growing canopy trees are expanding at the expense of slower-growing understorey species [6]. Understanding the mechanisms behind these changes is important for predicting their consequences for biodiversity, the global carbon cycle and the rate of climate change [7]. The cause of these changes has generated intense debate as it has implications for whether Amazonian forests are currently acting as a carbon sink and therefore slowing climate change. It has been suggested that the increase in biomass in many plots might be explained by recovery from disturbance events prior to monitoring [8]. If correct, simple extrapolations from the forest plot data to estimate a regional carbon sink may be sensitive to how well current networks sample the full disturbance/recovery mosaic [9]. Even if the current plot network is robust to this bias [10], it is important to understand whether the regional carbon sink is driven by recovery from disturbance, or increased resource availability [11], in order to predict its long-term trajectory and sensitivity to future fluctuations in climate and disturbance regimes. The only way to address this directly is to examine the history of currently monitored areas using palaeoecological techniques (e.g. [12]). Site locations: core site names are in boxes. (Adapted from [15]). Three sites with differing characteristics (e.g. ombrotrophic and minerotrophic) and demonstrating strong potential for high-resolution palynological analysis were selected from the aforementioned survey [15] for further study. These are described below: Long-term Forest Dynamics in Peruvian Amazonia1Jones,T.D., 1Roucoux,K.R., 1Baker,T.R., 2Gosling,W.D., 1,3Honorio,E., 4Lähteenoja,O., 1Lawson,I.T. Mean rate of stem recruitment, stem mortality, and their difference (with 95% confidence intervals), determined from 50 long-term monitoring plots across South America (1971-2002). Solid lines = additions; dotted lines = losses; lines with error bars = difference [3]. • Quistococha • Mauritia flexuosa palm swamp • Nutrient-poor ombrotrophic peatland [16] • pH 3.14, conductivity 73.5 µS cm-1 • 5.90 m sediment core obtained; consisting of 4.13 m peat; remainder grey clay • Basal peat horizon previously radiocarbon dated to 2335 cal yr BP [15]. This aguajale is found adjacent to Lake Quistococha. A lake sediment core was retrieved from the lake to allow comparison with the peat cores. Lake gyttja is underlain by similar grey clay to that found below the peat in the aguajale. A full vegetational succession sequence should be recorded in the Quistococha peat core, documenting the initiation and growth of the palm swamp forest associated with infilling of the lake. Above: Lake Quistococha and adjacent palm swamp forest. A) B) C) • 2. Buena vista • Seasonally flooded forest • Minerotrophic peatland –nutrients from flooding • pH 4.75; conductivity 113.3 µS cm-1 • 3.65 m sediment core; consisting of 3.25 m peat; remainder grey clay • Basal peat horizon previously dated to 1217 cal yr BP [15]. • 3. RESEARCH OBJECTIVES • This research will investigate the potential of Peruvian peat sequences to produce pollen records of the local vegetation history over the past 3000 years (focusing in most detail on the last 1000 years). Specifically we aim to: • Characterise the peat sequences using sedimentological analyses to establish the nature and timing of peat accumulation; • Produce pollen and charcoal records spanning the last 1000 years at c.50-year resolution. This will allow greater understanding of succession and disturbance processes; • Monitor vegetation change; permanent vegetation and carbon monitoring plots of 0.5 ha have been set up around each coring location to facilitate a detailed floristic inventory at each core site and provide means to monitor changes in the future. This work complements the existing network of regional plots [13]. • Establish the relationship between pollen rain and vegetation by comparing pollen assemblages in surface samples with floristic inventory data obtained around the core sites. Above: A) Peat core from the Quistococha aguajale (3.15-3.65 m depth); B) Transition into clay beneath the peat in the aguajale (4.05-4.55 m); C) Lake Quistococha sediment core – grey clay (6.79-7.39 m). 1. INTRODUCTION The dynamics of tropical forests are changing, with significant implications for the global carbon cycle and regional climate, but monitoring of forests has been undertaken systematically only since the 1970s. We are investigating the potential of peat sequences in northwest Amazonia, recently dated and found to accumulate exceptionally rapidly, to provide finely-resolved pollen records that extend the forest history back over several millennia, providing a much-needed long-term perspective. These data will provide insights into the mechanisms driving current changes in tropical forest ecology and the sensitivity of these forests to future disturbance and climatic change. Above: Vegetation at the seasonally flooded site, Buena Vista • 3. San Jorge • Mauritiaflexuosapalm swamp and forest • Ombrotrophic raised bog • pH 2.76; conductivity 171 µS cm-1 • 6.35 m sediment core; consisting of 5.16 m peat; remainder grey clay • Basal layer of peat previously dated to 2850 cal yrs BP [15] Above: Forest disturbance in Peruvian Amazonia (Cecropia growing along the river bank) Above: San Jorge 4. METHODOLOGY d) Laboratory analysis a) Coring of peat and lake sediment b) Vegetation and the pollen rain c) Contemporary monitoring • Analysis of pollen and spores to determine vegetation history and composition of the modern pollen rain; • Charcoal analysis to reconstruct fire history; • Determination of organic content through loss on ignition; insights into mineralogy via magnetic susceptibility; • Chronological control by correlation of loss on ignition profiles with previously dated sequences from the sites [15]. New radiocarbon dates will also be obtained. Knowledge of the modern pollen rain assemblage is a pre-requisite for reliable interpretation of fossil pollen records [17]. Pollen traps were set up in the plots; they will be collected and re-set after one year to supplement information from the surface samples. All trees with diameter at breast height (DBH) >10 cm in the 0.5 ha plots were identified, tagged and the diameter measured. All stems with DBH >1 cm were measured in circular plots of 4 m radius around each pollen trap. Peat and lake sediments were obtained using a Russian peat corer. A raft was constructed for coring in the centre of Lake Quistococha. Pollen trap placed 5 m above the ground to avoid flooding. Aguaje palm (Mauritia flexuosa) pollen (60 µm diameter) References [1] Mahli, Y. et al. 2002. J. of Veg. Sci.13, 439-450. [2] Phillips, O.L. et al. 2004. Philos. T. Roy. Soc. B 359, 381-407. [3] Lewis, S.L. et al. 2004. Philos. T. Roy. Soc. B 359, 421-436. [4] Baker, T.R. et al. 2004. Global Change Biol. 10, 545-562. [5] Phillips, O.L. et al. 2002. Nature 418, 770-774. [6] Laurance, W.F. et al. 2004 Nature 428, 171-175. [7] Cox, P.M. et al. 2008. Nature 453, 212-215. [8] Wright, S.J. et al. 2005. Trends Ecol. Evol. 20, 553-560. [9] Fisher, J.I. et al. 2008. Ecol. Lett. 11, 554-563. [10] Gloor, E. et al. 2009. Global Change Biol., in press. [11] Lewis, S.L. et al. 2004b Philos. T. Roy. Soc. B 359, 437-462. [12] Bush et al. 2007. Philos. T. Roy. Soc. B 362, 209-218. [13] Peacock et al., 2007. Journal of Vegetation Science, 18: 535-542.[14] Marengo, J.A. 1998. Climatología de la zone de Iquitos, Perú. In Kalliola, R. and Flores Paitin, S. Geoecologia y desarrollo amazónico: estudio integrado en la zona de Iquitos, Perú. Annales Universitatis Turkuensis Ser A II 114. University of Turku, Finland. [15] Lähteenoja et al. 2009. Global Change Biol., 15: 2311-2320. [16] Lähteenoja et al. 2009. Catena, 79: 140-145. [17] Gosling et al., 2009. Rev. Pal. Pal., 153: 70-85.


