Download
1 / 16

E N D
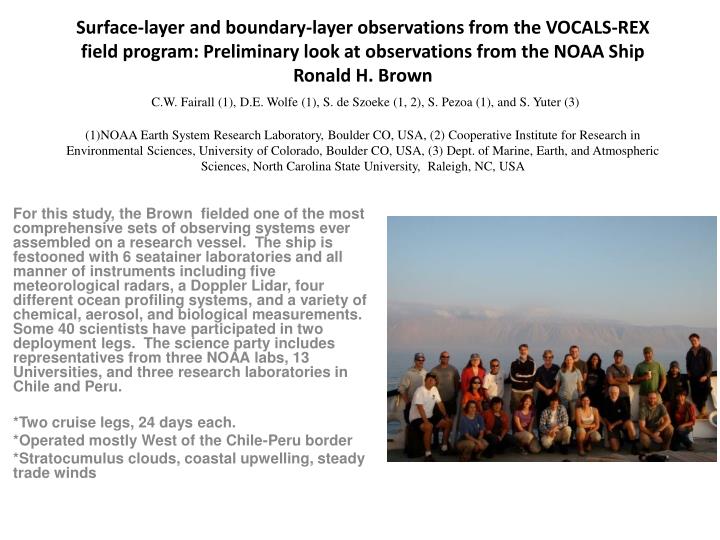
Surface-layer and boundary-layer observations from the VOCALS-REX field program: Preliminary look at observations from the NOAA Ship Ronald H. BrownC.W. Fairall (1), D.E. Wolfe (1), S. de Szoeke (1, 2), S. Pezoa (1), and S. Yuter (3)(1)NOAA Earth System Research Laboratory, Boulder CO, USA, (2) Cooperative Institute for Research in Environmental Sciences, University of Colorado, Boulder CO, USA, (3) Dept. of Marine, Earth, and Atmospheric Sciences, North Carolina State University, Raleigh, NC, USA For this study, the Brown fielded one of the most comprehensive sets of observing systems ever assembled on a research vessel. The ship is festooned with 6 seatainer laboratories and all manner of instruments including five meteorological radars, a Doppler Lidar, four different ocean profiling systems, and a variety of chemical, aerosol, and biological measurements. Some 40 scientists have participated in two deployment legs. The science party includes representatives from three NOAA labs, 13 Universities, and three research laboratories in Chile and Peru. *Two cruise legs, 24 days each. *Operated mostly West of the Chile-Peru border *Stratocumulus clouds, coastal upwelling, steady trade winds
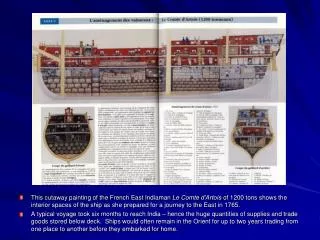
Solar/IR radiometers W-band antenna Motion Stabilized Sensors
Microwave Radiometers for Water Vapor/Liquid and Temperature University Miami and NOAA/ESRL/PSD Mailbox 183GHz 90GHz
Cloud Imaging Probe and sonic anemometer mounted on O3 deck. Cloud Ceilometer
Air-Sea Flux and Cloud Samples Selected variables from the W-E transect along 20 S from 85 W to 70 W. Upper panel is wind speed; the middle panel is sea surface and air temperatures; the lower panel shows sensible (Hsen) and latent (Hlat) heat fluxes. Leg 2 time series of ceilometer cloud base height
Surface Heat Flux Components Flux Components Cloud Forcing
Cloud Views Time-height cross section from 1 hour of data beginning at 0500 on Nov. 28 from ESRL/PSD W-band cloud radar. The top panel is the radar reflectivity (dBZ); the middle panel is the mean Doppler velocity (m/s, positive down); the bottom panel is the Doppler width (m/s) of the return. Time series of ceilometer cloudbase height for November 28.
Combined Ceilometer – Cloud Radar Time series of cloud properties for November 28, 2008. Upper panel: cloud top height (circle with solid line; ±1 standard deviation, dashed line) and cloud base height (diamonds with solid line; 1 standard deviation, dots). Lower panel: mean radar backscatter for the cloud/drizzle layer (circle with solid line) and mean droplet fall speed (x’s with solid line) multiplied by 10 (in m/s).
PPI C-Band Radar Spatial Views RHI 35° 2 km 1 km PHOTO IN DIRECTION OF RHI
Short Term Processing • Compute direct covariance turbulent fluxes • Second pass on all variable corrections • W-band radar ship motion corrections • Reprocesses Microwave LWP retrievals (PZ) • W-band radar microphysical retrievals • Combined radar, ceilometer, microwave set VOCALS data to soon appear at ftp://ftp.etl.noaa.gov/et6/cruises/