Hepatitis C
Hepatitis C. New Treatments, New Challenges Christopher Murphy MD, Ellis Family Medicine Residency RFMC, Sept. 8 th , 2012. Far East Asia 60 M. Eastern Europe 10 M. Western Europe 5 M. United States 3-4 M. Southeast Asia 30-35 M. Africa 30-40 M. Americas 12-15 M.

Hepatitis C
E N D
Presentation Transcript
Hepatitis C New Treatments, New Challenges Christopher Murphy MD, Ellis Family Medicine Residency RFMC, Sept. 8th, 2012
Far East Asia 60 M Eastern Europe 10 M Western Europe 5 M United States 3-4 M Southeast Asia 30-35 M Africa 30-40 M Americas 12-15 M Australia 0.2 M Hepatitis C: A Global Health Problem~200 Million (M) Carriers Worldwide World Health Organization. Weekly epidemiological record. 1999;74:421-428.
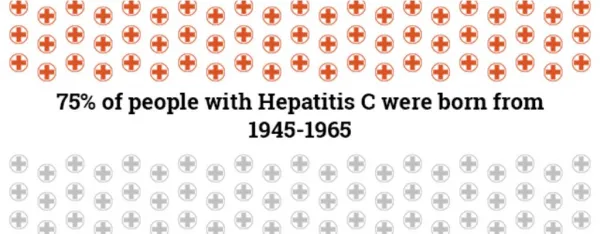
HEP C in the united states ● Incidence: ~ 17,000 new cases / yr. ● 4 million HCV- infected in U.S. ● Prevalence: General pop. 1% IVDUs 80-90% Incarcerated 15% HIV-infected 30%
HEP C in the united states ● Prevalence of Cirrhosis 9.0% in 1996. 18.5% in 2006. ●Prevalence of liver cancer 0.1% in 1996. 1.3% in 2006. ● ~12,000 deaths each year.
MOST CASES ARE NOT YET DIAGNOSED
Liver disease in the united states Chronic Hepatitis C The Economic Cost
Single-stranded RNA virus • Class: Flaviviridae • 6 genotypes • >90 subtypes • ~70% are type 1 in US • 1a > 1b (57% vs. 16%) • 30% are type 2 or 3
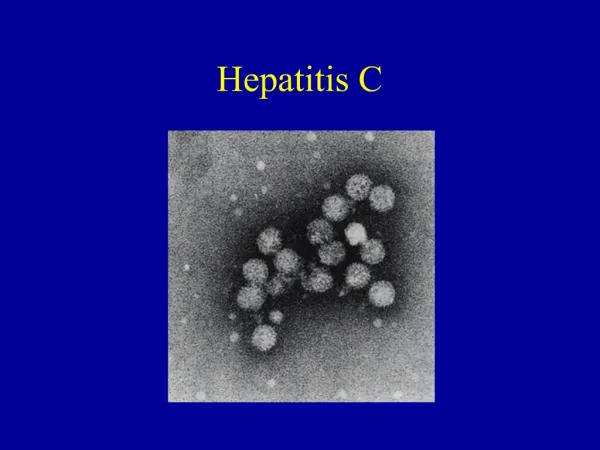
Anti-HCV Symptoms +/- HCV RNA Titer ALT Normal 6 1 2 3 4 0 1 2 3 4 5 Years Months Time after Exposure Serologic Pattern of Acute HCV Infection with Recovery Source: Centers of Disease Control & Prevention,Hepatitis C, Division of Viral Hepatitis, 1/17/03, http://www.cdc.gov/ncidod/diseases/hepatitis/slideset/hep_c/hcv_epi_for_distrib_000925.pdf
Anti-HCV Ab • Symptoms +/- • HCV RNA • Titer • ALT • Normal • 2 • 3 • 4 • 0 • 1 • 2 • 3 • 4 • 5 • 6 • // • 1 • Months • Years • Time after Exposure Serologic Pattern of Acute HCV Followed By Chronic Infection NORMAL
100People 15% 85% Resolve (15) Chronic (85) 80% Leading Indication for Liver Transplant 20% Stable (68) Cirrhosis (17) 75% 25% Stable (13) Death (4) Natural History of HCV Infection Recommendations for prevention and control of hepatitis C virus (HCV) infection and HCV-related chronic disease. Centers for Disease Control and Prevention, MMWR, 1998 Oct 16;47(RR-19):1-39.
Hepatocyte Stellate Cell Kupffer cell in sinusoidal lumen Endothelial Cell Collagen
Hepatitis C Disease Pathogenesis CD4+ CD8+ Cytokines(IL-2, IFN-TNF-a, TGF-PDGF) Cell killing TGF- Activation Death Kupffer cell Hepatic stellate cells Hepatocytes Fibrosis
Stage 1 Portal fibrosis Stage 2 Periportal fibrosis Stage 3 Septal fibrosis Stage 4 Cirrhosis
Metavir Scoring System F-1: @ the portal triad F-2: Periportal area F-3 Bridging from one portal to another F-4 Complete encircling of the triads F-4 pts have a lower response rate to Tx AND a higher rate of complications to Tx.
Evolution of HCV Therapy 2001 PegIFN/RBV
Pegylated-interferon alfa-2a + RBV: SVR in Genotype 1, High Viral Load PEG-IFN2a 180 µg SC QW + RBV 47 50 40 36 26 30 SVR (%) 16 20 10 n = 50 n = 47 n = 190 n = 186 0 RBV1000-1200 mg/day RBV800 mg/day RBV800 mg/day RBV 1000-1200 mg/day 24 Weeks 48 Weeks Hadziyannis et al. Ann Intern Med 2004;140:370-381
EVR EOTR SVR GT 1 pts 37.5% SVR 9 1 in treatment 10 14 1 failed 3failed 24 2 DNF 47 7 DNF 23 160 1 failed 113
Evolution of HCV Therapy 2001 2011 PegIFN/RBV Protease inhibitor
Important Dates in the History of Hepatitis C • Sustained virologic response= SVR = cure
Evolution of HCV Therapy 2001 2011 Beyond PegIFN/RBV Protease inhibitor Nucleos(t)ide polymerase inhibitor Nonnucleoside polymerase inhibitor NS5A inhibitor
Chronic Hepatitis C Viral clearance Prevent cirrhosis Goals of Antiviral Therapy Reverse fibrosis, delay decompensation, and reduce deaths Prevent HCC Prevent cirrhosis and HCV recurrence afterliver transplantation
Assessing Severity of Hepatitis C • Estimate prognosis. • Guide to aggressiveness of therapy.
Assessing Severity of Hepatitis C Standard labs and Scans AST / ALT T.BILI, Albumin, INR Platelet count Ultrasound Liver Biopsy inflammation fibrosis Fibro-elastography FibroScan® Liver Fibrosis Markers • Hepascore® • Fibrosure
Liver Biopsy Gold standard for grading and staging disease However, not necessary to treat HCV! Invasive, expensive Needle liver biopsy samples < 1/50,000th of the liver Incorrect staging of 1 stage in 10% to 20% of cases Dependent on Length of biopsy—25 mm optimal (16%) Number of biopsies performed Type of biopsy needle used Etiology of liver disease P-33
Potential for Sampling Error in Liver Biopsies Bedossa P, et al. Hepatology. 2003;38:1449-1457. Reproduced with permission.
Chronic Hepatitis C • FDA-Approved Therapies • Previous Standard of Care: • Pegylated interferon alfa-2a • with ribavirin • Pegylated interferon alfa-2b • with ribavirin
HCV Standard of Care Prior to May 2011 • GT1 (most common in US, Europe) least responsive to pegIFN/RBV PegIFN alfa-2a 180 µg/wk + Weight-Based RBV (1000 or 1200 mg/day) for 48 Wks[2] PegIFN alfa-2b 1.5 µg/kg/wk + RBV 800 mg/day for 48 Wks[1] 100 100 82 76 80 80 56 60 60 54 SVR (%) 46 42 40 40 20 20 n = 511 348 147 n = 453 298 140 0 0 Overall GT1 GT2/3 Overall GT1 GT2/3 1. Manns MP, et al. Lancet. 2001;358:958-965. 2. Fried MW, et al. N Engl J Med. 2002;347:975-982.
Chronic Hepatitis C Negative Predictive Factors for SVR • Genotype1 • African-American ethnicity • High HCV RNA levels • Failure to achieve early (12-week) response • Presence of advanced fibrosis, steatosis or cirrhosis • Long duration of disease • Older age at time of treatment (>45 y) • Higher body weight/BMI • Male gender
C allele is associated with SVR Ge, Nature, 2009
HCV Life Cycle and DAA Targets Receptor bindingand endocytosis Transportand release Fusion and uncoating ER lumen Virionassembly (+) RNA LD LD LD Translation andpolyprotein processing Membranousweb RNA replication NS3/4 protease inhibitors NS5B polymerase inhibitors Nucleoside/nucleotide Nonnucleoside ER lumen NS5A* inhibitors *Role in HCV life cycle not well defined Adapted from Manns MP, et al. Nat Rev Drug Discov. 2007;6:991-1000.
HCV-specific Enzymes: Targets for the Future C E1 E2 NS2 NS3 NS4B NS5A NS5B 5’ UTR 3’ UTR P7 NS4A IRES NS3 Helicase domain NS5B RNA-dependent RNA polymerase NS3 Protease domain NS3 Bifunctional protease/helicase
Phase III Protease Inhibitor Studies • Boceprevir • Treatment-naïve • SPRINT-2[4] • Treatment-experienced • RESPOND-2[5] • Telaprevir • Treatment-naive • ADVANCE[1] • ILLUMINATE[2] • Treatment-experienced • REALIZE[3] 1. Jacobson IM, et al. N Engl J Med. 2011;364:2405-2416. 2. Sherman KE, et al. N Engl J Med. 2011;365:1014-1024. 3. Zeuzem S, et al. N Engl J Med. 2011;364:2417-2428. 4. Poordad F, et al. N Engl J Med. 2011;364:1195-1206. 5. Bacon BR, et al. N Engl J Med. 2011;364:1207-1217.
Schematic of Study Design • International, multicenter, randomized, double-blind, placebo-controlled phase III trial Wk 8 Wk 24* Wk 48* Wk 12 Stratified by genotype 1 subtype and HCV RNA level T8PR: Telaprevir 750 mg q8h + PegIFN/RBV† (n = 364) PegIFN/RBV†‡ eRVR: follow-up No eRVR: pegIFN/RBV† Treatment-naive patients with genotype 1 HCV infection (N = 1088) T12PR: Telaprevir 750 mg q8h + PegIFN/RBV† (n = 363) PegIFN/RBV† eRVR: follow-up No eRVR: pegIFN/RBV† PR: Placebo + PegIFN/RBV† (n = 361) PegIFN/RBV† *SVR determined after 24 wks of follow-up. †PegIFN alfa-2a 180 µg/wk + RBV 1000-1200 mg/day. ‡Placebo given with pegIFN//RBV from Wks 8-12. Jacobson IM, et al. N Engl J Med. 2011;364:2405-2416.
Main Findings of ADVANCE (TVR) *P < .001 vspegIFN/RBV control arm. Jacobson IM, et al. N Engl J Med. 2011;364:2405-2416.
Main Findings • Patients who attained eRVR had higher SVR rates than those without eRVR across all arms 97 100 89 eRVR No eRVR 83 80 60 54 50 SVR (%) 39 40 20 0 T8PR T12PR PR Jacobson IM, et al. N Engl J Med. 2011;364:2405-2416.
SVR Rates With BOC + PegIFN/RBV in Genotype 1 Treatment-Naive Patients SPRINT-2 P < .001 P = .004 P < .001 P = .04 100 100 80 80 68 67 60 60 53 Patients (%) Patients (%) 40 42 40 40 23 20 20 125/311 211/316 213/311 n/N= 12/52 22/52 29/55 n/N= 0 0 PR 48 PR 48 BOC/PR48 BOC/PR48 BOC RGT BOC RGT Nonblack Patients Black Patients Poordad F, et al. N Engl J Med. 2011;364:1195-1206.
Response-Guided Therapy With TVR in Tx-Naive Pts in 2 Studies • 65% of patients eligible for shortened therapy[1] • 58% of patients eligible for shortened therapy[2] ADVANCE: TVR + PegIFN/RBV in Treatment-Naive Genotype 1 ILLUMINATE: Response-Guided TVR + PegIFN/RBV in Treatment-Naive Genotype 1 97 100 100 92 89 88 80 80 60 60 SVR in Pts Achieving eRVR (%) SVR in Pts Achieving eRVR (%) 40 40 20 20 189/212 28/29 149/162 140/160 n/N= n/N= 0 0 T12PR24 PR T12PR24 T12PR48 1. Jacobson IM, et al. N Engl J Med. 2011;364:2405-2416. 2. Sherman KE, et al. N Engl J Med. 2011;365:1014-1024.
REALIZE: SVR in Previous Relapsers, Partial Responders, Null Responders PR48 T12/PR48 LI T12/PR48 Previous Relapsers Previous Partial Responders Previous Null Responders 100 88* 83* 80 59* 54* 60 SVR (%) 40 33* 29* 24 15 20 5 121/145 124/141 n/N= 16/68 4/27 29/49 26/48 2/37 21/72 25/75 0 *P < .001 vs PR48. Zeuzem S, et al. N Engl J Med. 2011;364:2417-2428.
SVR by Response at Wk 4 in Lead-in Arm With BOC and TVR REALIZE (TVR) PROVIDE (BOC) Relapsers Partial NR Null NR 94 100 100 72 80 80 64 62 59 56† 56 55 60 54 60 SVR (%) SVR (%) 40 36 40 15 20 20 106/113 n/N = N/A 10/18 13/36 5/9 8/13 14/22 36/50 6/11 16/27 15/28 6/41 0 0 < 1 log ≥ 1 log < 1 log ≥ 1 log 1. Foster G, et al. EASL 2011. Abstract 6. 2. Bronowicki JP, et al. EASL 2012. Abstract 11. *Excludes 4 pts who dropped out during lead-in phase and 8 who were direct enrollers (ie no pegIFN/RBV lead-in).†Majority of prior relapsers still receiving treatment.
Current Standard-of-Care Therapy Is Complex • Adherence to pegIFN/RBV therapy decreases over time • Triple therapy has greatly increased treatment complexity, involves multiple daily pills plus injection drug • BOC TID: 12 pills/day • TVR TID: 6 pills/day • RBV BID: 4-6 pills/day • PegIFN: QW injection • Increased risks with nonadherence to triple therapy include potential for resistance Treatment Wk 100 97 95 95 100 0-12 89 86 84 13-24 76 80 25-36 37-48 60 Mean Adherence (%) 40 20 0 PegIFN RBV (N = 5706) Lo Re V 3rd, et al. Ann Intern Med. 2011;155:353-360.
Futility Rules for BOC or TVR + PegIFN/RBV in Tx-Naive Patients • Recommendation: All therapy should be discontinued in patients with the following: Assay should have a lower limit of HCV RNA quantification of ≤ 25 IU/mL and a limit of HCV RNA detection of approximately 10-15 IU/mL. 1. Boceprevir [package insert]. May 2011. 2. Ghany MG, et al. Hepatology. 2011;54:1433-1444.3. Telaprevir [package insert]. May 2011.