Download
1 / 18
180 likes | 295 Views
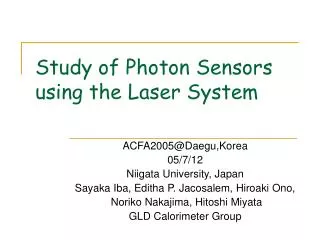
Study of Photon Sensors using the Laser System. ACFA2005@Daegu,Korea 05/7/12 Niigata University, Japan Sayaka Iba, Editha P. Jacosalem, Hiroaki Ono, Noriko Nakajima, Hitoshi Miyata GLD Calorimeter Group. Contents. Introduction Outline of new photon sensor – MPC

E N D
Study of Photon Sensors using the Laser System ACFA2005@Daegu,Korea 05/7/12 Niigata University, Japan Sayaka Iba, Editha P. Jacosalem, Hiroaki Ono, Noriko Nakajima, Hitoshi Miyata GLD Calorimeter Group
Contents • Introduction • Outline of new photon sensor – MPC • Setup of MPC measurement using laser system • Voltage dependence of signal and noise • Laser intensity dependence of signal • Pixel signal uniformity in one pixel • Sensor signal uniformity dependent on the pixel location • Summary • Future Plan
Fine segmentation scintillator Read out by photon sensor -> Study of photon sensor 1. Introduction • Present design of GLD Calorimeter • We might need smaller segmentation calorimeter • 10x40x2mm strip type scintillator X, Z-layer strip scintillator : 10x200x2mm Tile-layer : 40x40x1mm This granularity will be checked by simulation soon
MPC 400pixels ~100um ~85um MPC 100pixels (10x10pixels) 2. New photon sensor --MPC-- • MPC :Multi pixels Photon Counter • Made by Hamamatsu Photonics and under development • Each pixel is in Geiger mode and as a whole pixels they worked in avalanche mode • Compact device • Works with much lower voltage than PMT • Suitable for wavelength shifter fiber • We have two types of MPC • 100pixels : 10x10pixels • 400pixels : 20x20pixels
3. Setup of MPC measurement using laser system Logic readout YAG Laser MPC YAG Laser Wave length & power: 532nm (10mJ/cm2), 1064nm (20mJ/cm2) Filter : Laser intensity is down to10-8 Trigger : from Laser system Pulse width : <10nsec Laser beam minimum spot size : <2um Precision of laser position : ±2um MPC Output circuit
0pixel (0photon) 1pixel (1photon) 2pixel (2photon) Signal • From the ADC graph, we calculated the Charge output of 1pixel which is ~ 2.5pc and Gain is ~107 for 100pixels MPC 10mV signal 500nsec trigger View from oscilloscope MPC : 100pixels From ADC signal MPC : 100pixels
4. Sensor bias dep. of 1pixel PH at 532nm 100pixels 400pixels PH PH 49.6V 48.4V 48.5V 51.0V The laser light covered all pixels (100pixels) • Below 48.6V of 100pixels, signal was low rate • Above 49.4V of 100pixels and above 50.6V of 400pixels, there were long tail of signal and exceeds the gate width (Gate full width: 1us)
Noise level • Noise level = Sensor bias dependent of Pedestal sigma • We wanted to know the best operation voltage, so we used Noise level and S/N for above-mentioned condition • 100pixels : Noise level rapidly increases as bias voltage increases • 400pixels : Noise increase is more gently than that of 100pixels 30 3 400pixels 100pixels σ σ 49.6V 48.4V 48.5V 51.0V
100pixels 400pixels much tail highest region much tail flat region 49.0V 50.3V 48.5V 49.6V 48.4V 51.0V S/N • S/N = Pulse Height / Pedestal sigma • 100pixels: S/N peak was ~49.0V as the best operation voltage • 400pixels: S/N peak was above 50.5V. But it had long signal tail exceeding the gate width. So we decided to use the lower voltage (50.3V) as the best operation voltage • 400pixels operation voltage is higher than that of 100pixels and also operation voltage range is wider than that of 100pixels S/N S/N
5. Laser intensity dependence • For getting the best laser intensity corresponding to 1photon injection • Measurement conditions • MPC : 100pixels • Laser hitting area : within the 1pixel • Wavelength : 532nm • Used filter : for laser intensity down to10-8 • We think laser intensity 160 corresponds to 1photon injection, because this value is beginning of max of 1photon and min of 0photon Laser intensity 160 for 1photon injection # of event (0pe, 1pe) vs. Laser intensity ● : # of 0photon event ▲ : # of more than 1photon event
6. Pixel signal uniformity in one pixel (Position dependence between two pixels) • Checked efficiency between two pixels as uniformity measurement • Scanned 7points between two pixels • Wavelength : 532nm • Sensor bias : 49.0V • Efficiency of more than 1photon event becomes minimum at the boundary line between 2pixels Efficiency vs Position ▲: Efficiency of 0photon event ●:Efficiency of ≧1photon event Efficiency = # of 0 or 1photon event / # of All events pixel pixel
~85um ~30um ~35um Laser hitting area (smaller than 1pixel) 7. Sensor signal uniformity dependent on the pixel locations • Injected laser single photon to each pixel and got response • Measurement conditions • MPC : 100pixels • Sensor bias : 49.0V • Laser wavelength : 532nm • Laser hitting area is smaller than 1pixel area • Measured points are 50points that are shown as gray area Measured points : 50points (Gray pixels)
Pulse Height 1photon mean 0photon mean • Pulse height = 1photon mean value – 0photon mean value • Deviation of PH (RMS) : 10% • Laser long term fluctuation : ≦5% Pulse height vs Pixel position # of pixels Distribution of the PH
Cross sectional view (Central part) • Cross section of X-axis (line-5 + line-6) and Y-axis (line-5 + line-6) which are shown in previous slide • Central part of sensor Y-axis line-5+6 Cutting X-axis line-5▲ + line-6▲ X-axis line-5 +6 Cutting Y-axis line-5▲ + line-6▲
Y-axis line-9+10 X-axis line-9 +10 Cross sectional view (Edge part) Cutting X-axis line-9▲ + line-10▲ • Cross section of X-axis (line-9 + line-10) and Y-axis (line-9 + line-10) • Edge of sensor • We can see that pulse height level and deviation look same as previous slide Cutting Y-axis line-9▲ + line-10▲
Position dependence of efficiency • Compare efficiencies between 0photon events and more than 1photon events • Efficiency = #of 0photon (or ≧1photon) event / #of all photon events • Edge of sensor shows low signal efficiency • Central area of sensor has good efficiency Efficiency : 0photon Efficiency : ≧1photon
8. Summary • We measured two types of Hamamatsu MPC which are under development; 100pixels and 400pixels • Bias voltage dependence of PH, noise level and S/N were measured • Good operation voltage was 49.0V for 100pixels and 50.3V for 400pixels • Operation voltage range of 100pixels is smaller than that of 400pixels • Position dependence of PH, number of photons were measured with 532nm laser for 100pixels MPC • PH uniformity was 10% (RMS), while laser long term fluctuation was less than 5% • Central part of a sensor had good efficiency while edge part showed inefficiency in the light collection
9. Future plan • Try to connect scintillator strip and MPC through Wavelength-shifter fiber and to do beta-ray test • Measure more detail for 400pixels • Position dependence • Intensity dependence etc. • Supply our test results to Hamamatsu Photonics for further improvement MPC Setup of connection scintillator and MPC Thank you very much for listening !