Download
1 / 45
460 likes | 700 Views
The Climate System and Climate Change: The Atmospheric Component. James W. Hurrell jhurrell@ucar.edu Climate Analysis Section Climate and Global Dynamics Division. Climate and Global Change Geoscience Education Workshop 23 July 2002. Talk Outline. “Climate” versus “Weather”

E N D
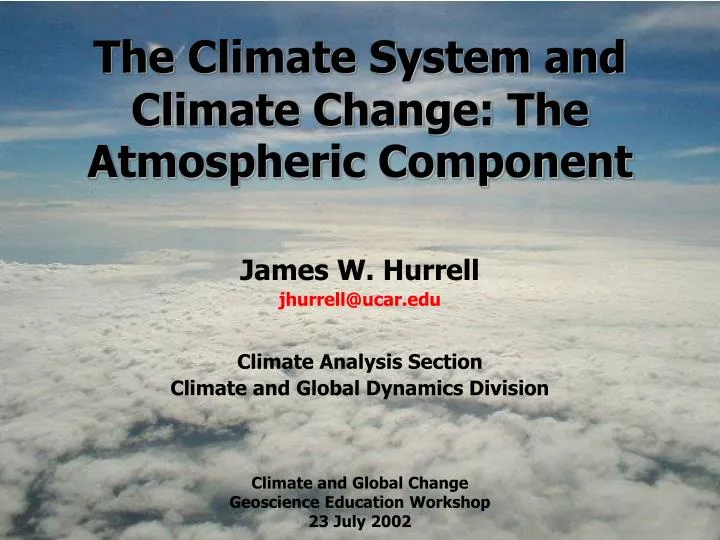
The Climate System andClimate Change: The Atmospheric Component James W. Hurrell jhurrell@ucar.edu Climate Analysis Section Climate and Global Dynamics Division Climate and Global Change Geoscience Education Workshop 23 July 2002
Talk Outline • “Climate” versus “Weather” • Climate system components • The atmosphere • Composition • Vertical Structure • Motions • Spatial structure of climate variability • North Atlantic Oscillation • Observed climate change
Climate versus Weather Weather • Short-term (and large) fluctuations that arise from internal instabilities of the atmosphere • Occurs as a wide variety of phenomena that we often experience • Effects are immediately felt • Social and economic impacts are great but are usually localized • Many such phenomena occur as part of larger-scale organized systems • Evolution is governed by nonlinear, chaotic dynamics • Not predictable deterministically beyond a week or two
Climate versus Weather Climate • Defined as the average state of the atmosphere over a finite time period over a number of years • Can be thought of as the “prevailing” weather, which includes the mean but also the range of variations • The wide range of natural variability associated with daily weather means small climate changes are difficult to detect • Intimate link between weather and climate provides a basis for understanding how weather events might change under a changing climate
Climate change and its manifestation in terms of weather (climate extremes)
Climate change and its manifestation in terms of weather (climate extremes)
Climate change and its manifestation in terms of weather (climate extremes)
Climate versus Weather Climate • Defined as the average state of the atmosphere over a finite time period over a number of years • Can be thought of as the “prevailing” weather, which includes the mean but also the range of variations • The wide range of natural variability associated with daily weather means small climate changes are difficult to detect • Intimate link between weather and climate provides a basis for understanding how weather events might change under a changing climate • Involves atmospheric interactions with other parts of the climate system and external forcing • Climate prediction is complicated by considering the complex interactions between, as well as changes within, all components
Climate System Components • Atmosphere • Fastest changing and most responsive component • Previously considered the only “changing” component • Ocean • The other fluid component covering ~70% of the surface • Plays a central role through its motions and heat capacity • Interacts with the atmosphere on days to thousands of years • Cryosphere • Includes land snow, sea ice, ice sheets, and mountain glaciers • Largest reservoir of fresh water • High reflectivity and low thermal conductivity • Land and its biomass • Slowly changing extent and position of continents • Faster changing characteristics of lakes, streams, soil moisture • and vegetation • Human interaction • agriculture, urbanization, industry, pollution, etc.
Mechanisms of Climate Variability: External versus Internal Forcing External • Changes in the Sun and its output, the Earth’s rotation rate, Sun-Earth geometry, and the slowly changing orbit • Changes in the physical make up of the Earth system, including the distribution of land and ocean, geographic features of the land, ocean bottom topography, and ocean basin configurations • Changes in the basic composition of the atmosphere and ocean from natural (e.g., volcanoes) or human activities Internal • High frequency forcing of the slow components by the more rapidly varying atmosphere • Slow variations internal to the components • Coupled variations: Interactions between the components
The Atmosphere • A thin envelope around the planet • 90% of its mass (5.1 x 10¹⁸ kg) is within 16 km (10 mi) of the surface (about 0.0025 times the radius of the Earth) • Atmospheric motions can therefore be considered to occur “at” the Earth’s surface • The basic chemical composition of dry air is very uniform across the globe and up to about 100 km • The greatest and most important variations in its composition involve water in its various phases • Water vapor • Clouds of liquid water • Clouds of ice crystals • Rain, snow and hail
TRACE GASES Argon (.93%) and Carbon Dioxide (.03%) Ozone (.000004%) Composition of the Atmosphere Dry Air Solid particles (dust, sea salt, pollution) also exist Water vapor is constantly being added and subtracted from the atmosphere, and varies from near 0% (deserts) to 3-4% (warm, tropical oceans and jungles)
Greenhouse Gases • Nitrogen, Oxygen and Argon (99.9% volume mixing • ratio) have only limited interaction with incoming • solar radiation, and they do not interact with the • infrared radiation emitted by the Earth • A number of trace gases (carbon dioxide, methane, • nitrous oxide, and ozone) do absorb and emit • infrared radiation (as does water vapor) • Water vapor, carbon dioxide and ozone also absorb • solar shortwave radiation • Because they emit infrared radiation up- and • downward, these greenhouse gases increase the • energy received at the Earth’s surface, thus raising • the temperature
Changing Atmospheric Composition: Indicators of the Human Influence Global, well-mixed greenhouse gas (GHG) concentrations CO2 • 31% increase since 1750: Highest levels • since at least 420,000 years ago • Rate of increase unprecedented over • at least the last 20,000 years 1000 1200 1400 1600 1800 2000 Year CH4 • Increased 150% since 1750 to its highest • levels in at least 420,000 years • Has both natural (e.g., wetland) and • human-influenced sources (e.g., landfills, • agriculture, natural gas activities) • Accounts for 20% of total GHG forcing N2O • Increased 16% since 1750 to its highest • levels in at least 1,000 years • Has both natural (e.g., soils and oceans) • and anthropogenic sources • Accounts for 6% of total GHG forcing • Halocarbons (e.g., CFCs) account for 14%
Changing Atmospheric Composition: Indicators of the Human Influence Global, well-mixed greenhouse gas (GHG) concentrations CO2 • 31% increase since 1750: Highest levels • since at least 420,000 years ago • Rate of increase unprecedented over • at least the last 20,000 years CH4 • Increased 150% since 1750 to its highest • levels in at least 420,000 years 1000 1200 1400 1600 1800 2000 Year N2O • Increased 16% since 1750 to its highest • levels in at least 1,000 years • Has both natural (e.g., soils and oceans) • and anthropogenic sources • Accounts for 6% of total GHG forcing • Halocarbons (e.g., CFCs) account for 14%
Changing Atmospheric Composition: Indicators of the Human Influence Global, well-mixed greenhouse gas (GHG) concentrations CO2 • 31% increase since 1750: Highest levels • since at least 420,000 years ago • Rate of increase unprecedented over • at least the last 20,000 years CH4 • Increased 150% since 1750 to its highest • levels in at least 420,000 years N2O • Increased 16% since 1750 to its highest • levels in at least 1,000 years 1000 1200 1400 1600 1800 2000 Year
Vertical Structure of the Atmosphere 4 distinct layers determined by the change of temperature with height
Extends to 10 km in the extratropics, 16 km in the tropics • Contains 80-90% of the atmospheric mass, and 50% is • containted in the lowest 5 km (3.5 miles) • It is defined as a layer of temperature decrease • The total temperature change with altitude is about 72°C • (130°F), or 6.5°C per km (lapse rate) • It is the region where all weather occurs, and it is kept • well stirred by rising and descending air currents • Near 11 km resides the “jet stream” • The transition region of no temperature change is the • “tropopause”: it marks the beginning of the next layer
Vertical Structure of the Atmosphere 4 distinct layers determined by the change of temperature with height
Extends to about 50 km • It is defined as a layer of temperature increase and • is stable with very little vertical air motion – a good place to fly! • Why does temperature increase? In part because of ozone, formed • as intense ultraviolet solar radiation breaks apart oxygen molecules • Near the ozone maximum (about 25 km), there are still only • 12 ozone molecules for every million air molecules • Yet, the absorption of ultraviolet radiation by ozone shields the • surface and warms the stratosphere • The transition region to the next layer is the “stratopause”
Vertical Structure of the Atmosphere 4 distinct layers determined by the change of temperature with height
Extends to about 85 km • Few ozone molecules, and the extremely thin air loses more energy • than it gains, so the temperature decreases with height • With so few molecules to scatter light, the sky is dark • The air pressure is 1000 times lower than at the surface • (99.9% of the atmosphere’s mass is below the mesosphere) • Exposure to solar radiation would severely burn our bodies! • The transition region to the next layer is the “mesopause”
Vertical Structure of the Atmosphere 4 distinct layers determined by the change of temperature with height
Contains 0.01% of the atmospheric mass • An air molecule can travel 1 km before colliding with another! • If we measure temperature with a thermometer, the reading • is near absolute zero (0 K, or -460°F), not 1500°F. Why? • The temperature of a gas is related to the average speed at • which molecules are moving • Even though air molecules in this region are zipping around at very • high speeds, there are too few to bounce off a thermometer bulb • to transfer energy to record a reading • This explains why astronauts on space walks can survive such high • temperatures: the traditional meaning of “hot” and “cold” is no • longer applicable
The Global Energy Budget: Driver of Atmospheric Motion A balance exists between the incoming solar and outgoing longwave energy averaged over the globe and the year However, the tilt of the Earth means this balance is not maintained for each latitude SURPLUS DEFICIT
To compensate for this energy • imbalance, winds in the • atmosphere and currents in the • oceans transport cold air and • water toward the equator • About 1/3 of this transport • occurs from the evaporation of • tropical waters and subsequent • transport into high latitudes, • where it condenses and • releases latent heat • About 1/3 occurs from the • poleward transport of warm • waters by ocean currents • The remaining 1/3 occurs from • middle latitude cyclones and • anticyclones
“Extratropical Storms” Extratropical or middle middle latitude storms are embedded in the tropospheric westerlies Winds converging into the low, pull cold air from the poles toward the equator, and warm air from the equator to the poles.
Low Pressure High Pressure Anti-Cyclonic Turning: divergence leads to downward vertical motions. Cyclonic Turning: Convergence leads to upward vertical motions. Cold Air Warm Air
Northern Hemisphere Circulation System:Planetary Scale Waves
The Spatial Structure of Climate and Climate Variability L L H H H H H L L L L L • When averaged over time, planetary waves are geographically • anchored as a result of land/ocean contrasts and mountains • The result is high and low pressure systems that appear to persist • throughout the year: so-called semipermanent lows and highs • Variations in the strength of these semipermanent features • produce changes in weather and climate over large regions
The North Atlantic Oscillation warm & wet cold & dry L L cold & dry warm & wet H H Dominant Orchestrator of NH Weather and Climate Positive Phase Negative Phase • Changes in mean wind speed and direction • Changes in number, intensity, paths of storms • Changes in moisture transport
The North Atlantic Oscillation Winter Index 1864-2000 Lisbon minus Reykjavik Strong Westerly Flow onto Europe
NAO Influence on Winter Surface Temperature A substantial portion of the Northern Hemisphere warming in recent decades is associated with the upward trend in the NAO The Earth’s climate record includes both natural variability as as well as human-induced effects
NAO Influence on Winter Precipitation • This pattern, together with the upward trend in the NAO, is consistent • with observed changes in precipitation over the Atlantic basin • Advance of Scandinavian glaciers • Retreat of Alpine glaciers • Severe drought over parts of the Iberian peninsula • Together with surface warming, there are significant impacts, e.g. • Agriculture (longer growing season) • Energy supply/demand and water management • Marine and terrestrial ecosystems
Annual Global Mean Surface Temperature and Carbon Dioxide Concentrations Global Temperature (°C) CO2 Concentration (ppmv) T CO2 Year
Variations of the Earth’s Surface Temperature: 1000 to 2100 • 1000 to 1861, N. Hemisphere, proxy data; • 1861 to 2000 Global, Instrumental; • 2000 to 2100, SRES projections
Confidence in the ability of models to project future climate has increased Simulated Annual Global Mean Surface Temperatures
An increasing body of observations gives a collective picture of a warming world and other changes in the climate system • Global mean surface temperature increase • (NH, SH, land, ocean) • Melting of glaciers, sea ice retreat and thinning • Rise of sea levels • Decrease in snow cover • Decrease in duration of lake and river ice • Increased water vapor, precipitation and • intensity of precipitation over the NH • Less extreme low temperatures, more • extreme high temperatures
Global warming Heating Temperature & Evaporation water holding capacity atmospheric moisture greenhouse effect & rain intensity Floods & Droughts