Performance Debugging in Data Centers: Doing More with Less
360 likes | 486 Views
This work discusses performance debugging methods for data centers, centering on the need for effective monitoring with minimal intrusion. The study highlights the challenges presented by increasing scale, complexity, and the rapid processing demands of applications, particularly in investment banking contexts like equity trading. It proposes a four-step model to monitor operations, detect faults in near-real-time, and localize issues while minimizing instrumentation and intrusiveness. The findings emphasize the importance of practical solutions for automated performance debugging that do not compromise operational efficiency.

Performance Debugging in Data Centers: Doing More with Less
E N D
Presentation Transcript
Performance Debugging inData Centers:Doing More with Less Prashant Shenoy, UMass Amherst Joint work with Emmanuel Cecchet, Maitreya Natu, Vaishali Sadaphal and Harrick Vin
Data Centers Today • Large number of computing, communication, and storage systems • Wide range of applications and services • Rapidly increasing scale and complexity • Limited understanding and control over the operations
Equity Trade Plant Portion of the data center operated by an investment bank for processing trading orders; Nodes represent application processes; Edges indicate flow of requests;
Equity Trade Plant • Receives and processes • 4-6 million equity orders (trade requests) • 10-100 million market updates (news, stock-tick updates, etc.) • IT infrastructure for processing orders and updates consists of thousands of application components running on hundreds of servers Portion of the data center operated by an investment bank for processing trading orders; Nodes represent application processes; Edges indicate flow of requests;
Performance Debugging in Data Centers • Low end-to-end latency for processing each request is a critical business requirement • Increase in latency can be due to • Dynamic changes in workload • Slowing down of a processing node due to hardware or software errors • Performance debugging involves detecting and localizing performance faults • Longer localization time leads to greater business impact
Performance Debugging in Data Centers • Four key steps • Build a model of normal operations of a system • Place probes to monitor the operational system • Detect performance faults in near-real-time • Localize faults by combining the knowledge derived from model and monitored data
Performance Debugging in Data Centers • Four key steps • Build a model of normal operations of a system • Place probes to monitor the operational system • Detect performance faults in near-real-time • Localize faults by combining the knowledge derived from model and monitored data Effectiveness of these steps depends on the number and type of data collection probes available in the system. However, system administrators are reluctant to introduce probes into production environment, especially if the probes are intrusive (and can modify the system behavior)
Basic Practical Requirement • Minimize the amount of instrumentation to gather real-time operational statistics • Minimize the intrusiveness of the data gathering methods
Basic Practical Requirement • Minimize the amount of instrumentation to gather real-time operational statistics • Minimize the intrusiveness of the data gathering methods • Much of the prior research ignores this requirement and demands: • Significant instrumentation • (e.g., requiring probes to be placed at each process/server) • Significant intrusiveness • (e.g., requiring each request to carry a request-ID to track request flows)
Basic Practical Requirement System operators are always • Minimize the amount of instrumentation to gather real-time operational statistics • Minimize the intrusiveness of the data gathering methods • For automated performance debugging to become practical and effective, one needs to develop techniques that are more effective with less instrumentation and intrusiveness • We raise several issues and challenges in designing these techniques • Much of the prior research ignores this requirement and demands: • Significant instrumentation • (e.g., requiring probes to be placed at each process/server) • Significant intrusiveness • (e.g., requiring each request to carry a request-ID to track request flows)
Instrumentation Vs. Intrusiveness • Extent of instrumentation and amount of intrusiveness complement each other • E.g., collection of request component dependency • High instrumentation-Low intrusiveness • Each node monitors request arrival event • Low instrumentation-High intrusiveness • Each request stores information of the component it passes through
Instrumentation Vs. Intrusiveness • Extent of instrumentation and amount of intrusiveness complement each other • Collection of request component dependency • High instrumentation-Low intrusiveness • Each node monitors request arrival event • Low instrumentation-High intrusiveness • Each request stores information of the component it passes through Observation: It is possible to tradeoff the level of instrumentation against the level of intrusiveness needed for a technique
Instrumentation Vs. Intrusiveness • Extent of instrumentation and amount of intrusiveness complement each other • Collection of request component dependency • High instrumentation-Low intrusiveness • Each node monitors request arrival event • Low instrumentation-High intrusiveness • Each request stores information of the component it passes through Observation: It is possible to tradeoff the level of instrumentation against the level of intrusiveness needed for a technique Production systems place significant restrictions on which nodes can be instrumented as well as the level of intrusiveness permitted
Instrumentation Vs. Intrusiveness • Extent of instrumentation and amount of intrusiveness complement each other • Collection of request component dependency • High instrumentation-Low intrusiveness • Each node monitors request arrival event • Low instrumentation-High intrusiveness • Each request stores information of the component it passes through Observation 3: It is possible to tradeoff the level of instrumentation against the level of intrusiveness needed for a technique Production systems place significant restrictions on which nodes can be instrumented as well as the level of intrusiveness permitted Is it possible to achieve effective performance debugging using low instrumentation and low intrusiveness?
A Production Data Center: Characteristics and Constraints • 469 nodes • Each node represents an application component that processes trading orders and forwards them to downstream node • 2,072 links • 39,567 unique paths • SLO: end-to-end latency for processing each equity trade should not exceed 7-10ms
A Production Data Center: Characteristics and Constraints • 469 nodes • Each node represents an application component that processes trading orders and forwards them to downstream node • 2,072 links • 39,567 unique paths • SLO: end-to-end latency for processing each equity trade should not exceed 7-10ms • Environment imposes severe restrictions on the permitted instrumentation • and intrusiveness • No instrumentation of intermediate nodes purely for performance debugging • SLA compliance is monitored at exit nodes by time-stamping request entry and • exit • Available information • Per-hop graph • SLO compliance information at the monitors at exit nodes • No additional information is available
Problem Definition • Given: • System graph depicting application component interactions • Instrumentation at the entry and exit nodes that timestamp requests • Determine: • The root cause of SLO violations when one more exit nodes observe such violations
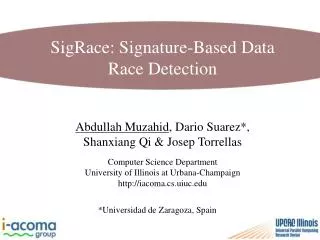
Straw-man Approaches • Signature-based localization • Online signature matching via graph coloring
Signature-Based Localization • Node signature: • Set of all monitors that are reachable from the node • K-bit string where each bit represents the accessibility of a monitor • In presence of a failure some monitors will observe SLO violation, thus creating a violation signature • Fault localization task is to determine the node that could have generated the violation signature 1110 1110 1111 0001 1110 0001 1000 0110 1000 0100 0010 0001 Query exit points (SLA validation)
Signature-Based Localization • Applying signature-based localization on equity trade plant system • Monitors on 112 exit nodes generated 112-bit signatures • Generated 137 unique signatures for 357 non-exit nodes • (38%) • Generated 71 unique signatures for 121 source nodes • (58%)
Root cause ofSLA violation Online signature matching • Graph coloring technique Clear suspect nodes that lead to a valid request execution Mark suspect nodes SLA violation
Deriving a System Model • Objective: • Real production systems are too large and complex to manually derive a system model • Need for automatic generation and maintenance of model • Challenges: • Need for reasonably low instrumentation and intrusiveness • Several low-cost mechanisms can be considered here • Network packet sniffing to derive component communication pattern • Examining application logs • to derive component communication pattern • to derive request flows
Monitor Placement • Objective: • Place monitors at suitable locations to measure end-to-end performance metrics • Challenges • Deployment of monitors involves instrumentation overhead • Need to minimize the number of monitors • Tradeoff between number of monitors and accuracy of fault detection and localization • Smaller number of monitors increases chances of signature collisions
Monitor Placement • Structure of graph affects the distribution of signatures across nodes • In the ideal case n unique signatures can be generated using log(n) monitors Nodes with same signature Nodes with same signature
Real-Time Failure Detection • Objective • Quick and accurate detection of the presence of failures based on observation at the monitor nodes • Challenges: • Differentiate between the effect due to workload change and failure • Deal with scenario where a node failure affects only few of the requests passing through the node • Transient failures
Fault Localization • Objective: • Identification of the root-cause of the problem after detecting failure at one or more monitor nodes (SLO violation signature) • Challenges: • Presence of multiple failures leads to composite signature • Edges from the failed node to the monitors are traversed in a non-uniform manner leading to partial signature • Transient failures • Inherent non-determinism in real systems (e.g. presence of load balancers)
Conclusions • Detecting and localizing performance faults in data centers has become a pressing need and a challenge • Performance debugging can become practical and effective only if it requires low levels of instrumentation and intrusiveness • We proposed straw man approaches for performance debugging and presented issues and challenges for building practical and effective solutions
Instrumentation for Failure Detection Observation 1: The instrumentation intrusiveness is a direct function of the performance metric of interest • End-to-end latency: difference of the timestamps of arrival and departure of requests • High instrumentation intrusiveness • Throughput: number of requests departing the system within a defined interval • Low instrumentation intrusiveness
Instrumentation for Fault Localization • Simple solution: Measure performance metrics and resource utilization at all servers • High instrumentation • High overhead (monitoring and data management) • Sophisticated solutions: Collect operational semantics of the system (e.g., request component dependencies) • Low instrumentation (not each node needs to be instrumented) • High intrusiveness (modifications at system, middleware, application level)
Instrumentation for Fault Localization • Collection of different system information require different level of intrusiveness • Per-hop graph indicating component interactions: simple network sniffing • Derivation of flow of requests: application aware monitoring (e.g. by insertion of transaction-id in the requests)
Characterizing State-of-the-art Observation 2: Most techniques require high instrumentation or high intrusiveness or both