Download
1 / 20
200 likes | 223 Views
Report on Marine Insurance Premium 1999 and 2000. Tore Forsmo The Central Union of Marine Underwriters Oslo, Norway Thanks also to Fédération Française des Sociétés d’Assurances (FFSA) – Direction des Assurances Transports (DMAT).

E N D
Report on Marine Insurance Premium 1999 and 2000 Tore Forsmo The Central Union of Marine Underwriters Oslo, Norway Thanks also to Fédération Française des Sociétés d’Assurances (FFSA) – Direction des Assurances Transports (DMAT)
Key IndicatorsWorld Tonnage on Order(as at 1 january 2000, in thousands of dwt)
Key IndicatorsThe Most Important Maritime Countries(total dwt tonnage > 20 Mio)(in percentage of world total dwt tonnage, as at 1 january 2000)
Key IndicatorsMaritime Engagement of 10 Major Trading Nations(as at the end of 1999)
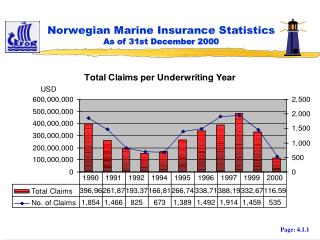
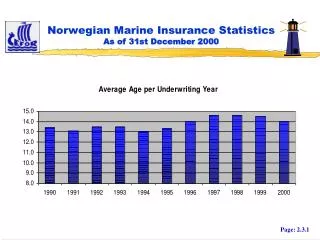
Report on marine insurance premiums 1999 and 2000 • By end of August 2001, 45 of 55 members reported their country’s marine premium figures for accounting year 1999 and 41 in addition for accounting year 2000. • Reported figures represent approx. 95% of the total marine premium written by all IUMI members for 1999 and approx. 93% for 2000 • Total premiums for 1999 is estimated to reach approx. USD 11.63 billion and for 2000 approx. USD 11.59 billion
Global Hull Transport/Cargo Marine Liability Offshore/Energy Total 2000 2.605 6.487 1.016 0.719 10.835 1999 2.770 6.805 0.763 0.611 11.045 1998 3.073 7.347 0.879 0.706 12.112 Index 98-99* 89% 92% 87% 89% 91% Index 99-00* 97% 96% 133% 119% 100% Report on marine insurance premiums(USD billions) Global premiums 1998-2000 (as rep. per end of August 2001) *Index based on figures from Associations who have reported in both years
Report on marine insurance premiums - Breakdown by economic areas(USD million)
Global Hull Premium - Major Markets 1992 - 2000(USD Million)
Global Cargo Premium - Major Markets 1992 - 2000(USD Million)
Ranking Average Annual Difference variation over 00-96 period 96-00 2000 1999 1998 1997 1996 2000 1996 Fiscal Bermuda 537,110 584,507 625,503 697,642 778,990 -241,880 -6.21% 1 1 Japan 103,048 122,224 114,511 122,047 123,428 -20,380 -3.30% 5 5 Luxembourg 271,508 286,455 299,947 322,618 334,863 -63,355 -3.78% 4 4 Norway 352,988 362,656 375,778 422,450 427,816 -74,828 -3.50% 3 3 Sweden 57,424 61,717 77,932 96,092 108,655 -51,231 -9.43% 6 6 UK 532,040 586,720 591,537 635,415 617,792 -85,752 -2.78% 2 2 US 30,004 29,221 24,822 30,427 34,618 -4,614 -2.67% 7 7 Total 1,884,122 2,033,500 2,110,030 2,326,691 2,426,162 -542,040 -4.47% MARINE MUTUAL MARKET SECTOR STATISTICSGross Calls (Premium) - Fiscal Domicile Per accounting year - USD 1000 Source: Standard & Poors Marine Mutual Report 2001
Ranking Average Annual variation over Difference 00-96 2000 1999 1998 1997 1996 period 96-00 2000 1996 Operational Japan 103,048 122,224 114,511 122,047 123,428 -20,380 -3.30% 3 3 Norway 352,988 362,656 375,778 422,450 427,816 -74,828 -3.50% 2 2 Sweden 57,424 61,717 77,932 96,092 108,655 -51,231 -9.43% 4 4 UK 1,340,658 1,457,682 1,516,987 1,655,675 1,731,645 -390,987 -4.52% 1 1 US 30,004 29,221 24,822 30,427 34,618 -4,614 -2.67% 5 5 Total 1,884,122 2,033,500 2,110,030 2,326,691 2,426,162 -542,040 -4.47% MARINE MUTUAL MARKET SECTOR STATISTICSGross Calls (Premium) - Operational location Per accounting year - USD 1000 Source: Standard & Poors Marine Mutual Report 2001
Report on marine insurance premiums - Accounting year 1999 (in USD 1000)
Report on marine insurance premiums - Accounting year 1999 (in USD 1000)
Report on marine insurance premiums - Accounting year 1999 (in USD 1000)
Report on marine insurance premiums - Accounting year 2000 (in USD 1000)
Report on marine insurance premiums - Accounting year 2000 (in USD 1000)
Report on marine insurance premiums - Accounting year 2000 (in USD 1000)