Renewable Energy
570 likes | 715 Views
Renewable Energy. Prof. Peter Seligman, D.Eng. Inspired by Sustainable Energy – without the hot air by David MacKay FRS. Google: withouthotair.

Renewable Energy
E N D
Presentation Transcript
Renewable Energy Prof. Peter Seligman, D.Eng
Inspired by Sustainable Energy – without the hot air byDavid MacKay FRS Google: withouthotair
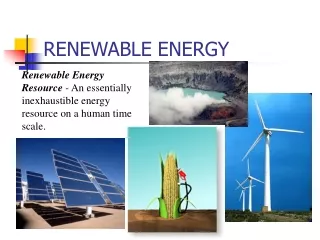
Definitions:Renewable: we can continue indefinitelySustainable: we can do it for a long time but eventually will have to come up with something different.Zero carbon: we may run out in the foreseeable future but it’s still worth doing.
How much energy do we use?from ABARES Australian Bureau of Agricultural and Resource Economicsabare-brs.gov.au
Primary energy:Domestic: 5.8 exajoules per annumExport: 13.8 exajoules per annum Exajoule = 1018 Joule
Our domestic primary energy use:Domestic: 5.8 exajoules per annum= 5.8 x 10¹⁸ joules or watt secondsdivide by 3.6 x 106 = 1.6 x 10¹² kWh/annumdivide by number of people: 22 x 106 = 73,200 kWh/annum/persondivide by hours in a year: 365 x 24= 8360 Watts/person
Our domestic primary energy use:8360 Watts/personx by 24/1000= 200 kWh/person/dayUK/Europe = 125 kWh/person/day
Primary energy: 8000 watts/personHeating 80% efficientElectricity generation 30% efficientTransport 20% efficientAverage efficiency 50% End-use energy: 4000 watts/person
Personal Food Electricity Gas Petrol Flying Stuff we buy House construction Public Factories Offices Shops Hospitals Schools Universities Public transport Sporting facilities Street lighting Cinemas, theatres Construction Where do we use energy?
About a quarter of our energy use is personal:1000 watt/personThree quarters of our energy use is public:3000 watt/person
Private 1000 watts (ten 100 watt globes) Our energy use
Our energy use • Public 3000 watts (thirty 100 watt globes)
Total end-use energy • Per person: 4000 watts (forty 100 watt globes)
Electricity useNational average electricity generation 25 GWover 22 million people:1100 watts/person
How much power can a 1000 watt photovoltaic system produce? = 160 watts average
How much power per person? = 40 watts average (remember we use 4000 watts each)
Output of a 1 kW solar panel • 1000 watts nominal peak in bright sunlight • 800 watts under realistic conditions (temperature and inverter efficiency) • 400 watts taking into account night time • 320 watts taking into account sun angle • 160 watts taking into account cloud • 40 watts each for a 4 person family
Role of domestic solar PV Elec. price rises due to distribution, not wholesale price Increase distribution costs due to aircons Each $1500 aircon adds $7000 to infrastructure cost PV can provide power locally when it is most needed (best facing NW at steep angle)
Renewable energy system • Wind • Solar • Geothermal • Wave • Utility scale energy storage • High voltage DC (and AC) links
How much power from the wind? 5 turbine diameter separation between turbines 2 watt/m2 2 – 3 turbine diameters in non-prevailing wind directions Typically: 4.5 watt/m2 Land is still suitable for farming
Wind Power • Turbines now up to 7.5 MW • Technologically mature • Capacity factor 30% • Average output 2.3 MW per turbine
Turbine technology • Enercon E126 turbines • 7.5 MW • Gearless design • 138m hub height • 127m blade diameter
A question of storageWind power in South Australia and Victoria From Wind farming in South Australia
Large scale solar - California 1984345 MW peak: 75 MW average http://www.itas.fzk.de/deu/tadn/tadn013/image37.jpg
Andasol 1 to 3 Granada Spain50 MW turbines 20MW average courtesy Ferrostaal AG.
Torresol Gemasolar Molten Salt Solar • solar power at night • “Baseload” “Dispatchable” solar – better than coal
How much power from the sun? Solar radiation: 1000 watts/m2 • Taking into account night-time and cloud 160 watts/m2 • Taking into account 15% efficiency 24 watts/m2 • Taking into account shading and access 4.5 – 15 watt/m2
How much of Australia? • 200 km square • 4.5 watt/m2 • 8000 watt/person
Geothermal energy from hot dry rocks http://sen.asn.au/renewables/geothermal
Geothermal resources in Australia • Hot Dry Rocks • Heat build-up in radioactive granite + residual heat from earth’s core • Typical power flow 50 – 100 millwatts/m2 • Not renewable but usable over 400 years • Could supply about 800 watts per person (end use)
Geothermal resources in Australia http://www.ga.gov.au/image_cache/GA10036.pdf
How much power from waves? • 2000 km of Australian south coast • 100 – 160 kW/linear metre • Extraction efficiency: 5 – 10% • Could supply about 900 watts per person (end use)
Tidal power? • North West Australia 10 metre tides: 150 watts per person (end use) • Port Phillip Bay 10 watts/Melbournian
Supply, demand and curtailment From BZE Zero Carbon Australia Stationary Energy Plan
Nullarbor pumped seawater electricity storage Bunda cliffs From Google Earth
High Voltage DC links Low loss power transmission over long distances No current due to line capacitance No eddy current losses is wires Lower peak voltage (or higher average voltage)
High voltage DC links 1700 km in the Congo, built 1982 Longest 2100 km, China Highest power: 6400 MW, China and India Basslink: 300km cable, 600 MW http://en.wikipedia.org/wiki/List_of_HVDC_projects
More HVDC details May use monopole (earth return) DC is the only practical solution to undersea cables Power loss: 2% / 1000km, 1.5% in converters http://www.utilities-me.com/article-690-electricity-highway-powers-through-china/
AC-DC-AC Converter http://www.energy.siemens.com/hq/pool/hq/power-transmission/HVDC/HVDC-Classic/TSQ-Valvehall-b.jpg
Transformer for High voltage DC power line Courtesy Siemens AG