Download
1 / 19
190 likes | 315 Views
Student Outcomes: Cohort Growth. Student Outcomes: Cohort Growth by Race. White. Black. Hispanic. Achievement Level and Score by Race (Texas). Student Outcomes: Achievement Level (Texas). Student Outcomes: Achievement Level (Massachusetts). Student Outcomes: Achievement Level (California).

E N D
White Black Hispanic Achievement Level and Score by Race (Texas)
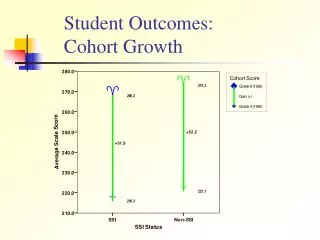
Figure 1. USI vs. Non-USI Districts: 1994 Third Grade Cohort Acrobat Document
Figure 2. USI vs. Non-USI Districts: 1995 Third Grade Cohort Acrobat Document
Figure 3. USI vs. Non-USI Districts: 1996 Third Grade Cohort
Comparison of State Assessment and NAEP for Texas (1992-1996)
ALIGNMENT The degree to which expectations and assessments are in agreement and serve in conjunction with one another to guide the system toward students learning what is expected.
SPECIFIC CRITERIA Content Focus A. Categorical Concurrence B. Depth-of-Knowledge Consistency C. Range-of-Knowledge Correspondence D. Structure-of-Knowledge Comparability E. Balance of Representation F. Dispositional Consonance
Four State StudyPercent of Standards with Acceptable AlignmentCategory State D State A State B State C
Four State StudyPercent of Standards with Acceptable AlignmentDepth of Knowledge State A State D State B State C
Four State StudyPercent of Standards with Acceptable AlignmentRange State D State A State B State C
Four State StudyPercent of Standards with Acceptable AlignmentBalance State D State A State B State C
Average 9th Grade Reading and Value-Added Measure of School Performance 9th Grade Reading, 2001 (Model 2)
SUMMARY • Continuous improvement should be judged on: • Change in percent basic and percent proficient • Size of the gap between racial groups • Performance of same group of students over • multiple years • Added value considering a multiple • of factors