Download
1 / 33
340 likes | 441 Views
Learn how to turn complex data into meaningful insights using effective information visualization techniques and strategies. Explore resources and examples to simplify data presentation for better understanding and decision-making.

E N D
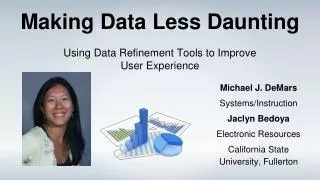
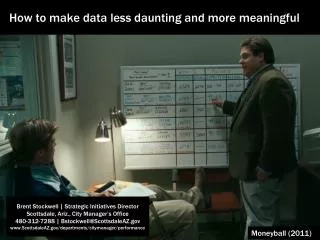
How to make data less daunting and more meaningful Brent Stockwell | Strategic Initiatives Director Scottsdale, Ariz., City Manager’s Office 480-312-7288 | Bstockwell@ScottsdaleAZ.gov www.ScottsdaleAZ.gov/departments/citymanager/performance Moneyball (2011)
“People… operate with beliefs and biases. • To the extent you can eliminate both and replace them with data, you gain a clear advantage.” • Michael Lewis | Moneyball: The Art of Winning an Unfair Game Moneyball (2011)
Pie I have eaten 12.5% 87.5% Pie I have not yet eaten
http://www.presentationzen.com/presentationzen/2007/03/a_few_weeks_ago.htmlhttp://www.presentationzen.com/presentationzen/2007/03/a_few_weeks_ago.html
http://www.infographicsarchive.com/new-infographic/video-infographic-infographic-of-infographics/http://www.infographicsarchive.com/new-infographic/video-infographic-infographic-of-infographics/
“effective information visualization (is) premised on: simplicity (complex notions simplified to save time for reader); transparency (visual honesty and responsibility in sourcing); creativity (design that is memorable and understandable); sociability (easily shared and improved)” http://www.edelman.com/p/6-a-m/visualizing-information/ @Sambrook
“effective information visualization (is) premised on: simplicity (complex notions simplified to save time for reader)
“effective information visualization (is) premised on: transparency (visual honesty and responsibility in sourcing)
“effective information visualization (is) premised on: creativity (design that is memorable and understandable)
“effective information visualization (is) premised on: sociability (easily shared and improved)
Edward R. Tufte The Visual Display of Quantitative Information, Edward R. Tufte, 2001 @EdwardTufte
“interior decoration of graphics generates a lot of ink that does not tell the viewer anything new.” Remove Chartjunk
“data graphics should draw the viewer’s attention to the sense and substance of the data, not to something else.” Increase Data-Ink
“Small, high-resolution graphics usually embedded in a full context of words, numbers, images. Sparklines are datawords: data-intense, design-simple, word-sized graphics.” Sparklines
Accessible Complexity: The Friendly Data Graphic The Visual Display of Quantitative Information, Edward R. Tufte, 2001, p. 183
Stephen Few Before For more bad examples http://www.perceptualedge.com/examples.php
After For more proposed solutions http://www.perceptualedge.com/examples.php
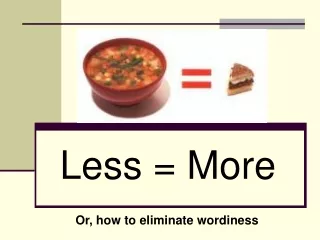
Everything should be made as simple as possible but no simpler. • “It can scarcely be denied that the supreme goal of all theory is to make the irreducible basic elements as simple and as few as possible without having to surrender the adequate representation of a single datum of experience.” • from “On the Method of • Theoretical Physics.” • Albert Einstein (1933)
Technology is faster, but not necessarily simpler… City of Scottsdale, FY 1964/65 Budget Book
Total Full-Time Attrition and Unemployment Rate 13.3% 11.0% Retirements 10.0% 9.3% 8.4% 4.4% Retirement Incentive Program Unemployment Rate Other Turnover
Facilities Growth and Facilities Staffing Facilities Growth Facilities Staffing
First Response Unit - Station 602 Area 10% more calls 77% 7% OTHERS 601 3% 603 3% PHX 1% TEMPE .2% 23% OTHERS 601 13% 603 7% PHX 4% TEMPE .3% 93% FY 2012/13 1.1 companies Station 602 6,784 Calls FY 2011/12 1.9 companies Station 602 6,161 Calls
Accuracy is the key to credibility http://rt.com/news/spanish-submarine-cannot-resurface-634/
Don’t overdo it http://www.independent.co.uk/incoming/article8757905.ece/BINARY/original/china-1.jpg
Design for your audience • Avoid default settings • Remove unnecessary information • Use animation feature to tell your story • Move beyond charts and use shapes/pictures • Ask for feedback – does it make sense to others?
“effective information visualization (is) premised on: simplicity (complex notions simplified to save time for reader); transparency (visual honesty and responsibility in sourcing); creativity (design that is memorable and understandable); sociability (easily shared and improved)” http://www.edelman.com/p/6-a-m/visualizing-information/ @Sambrook
Questions,Comments,Observations? Brent Stockwell | Strategic Initiatives Director Scottsdale, Ariz., City Manager’s Office 480-312-7288 | Bstockwell@ScottsdaleAZ.gov www.ScottsdaleAZ.gov/departments/citymanager/performance Moneyball (2011)