Download
1 / 36
360 likes | 523 Views
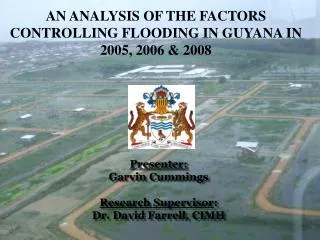
AN ANALYSIS OF THE FACTORS CONTROLLING FLOODING IN GUYANA IN 2005, 2006 & 2008. Presenter: Garvin Cummings Research Supervisor : Dr. David Farrell, CIMH. PRESENTATION OUTLINE. AIM AND OBJECTIVES OF THE RESEARCH INTRODUCTION FLOODING IN GUYANA

E N D
AN ANALYSIS OF THE FACTORS CONTROLLING FLOODING IN GUYANA IN 2005, 2006 & 2008 Presenter: Garvin Cummings Research Supervisor: Dr. David Farrell, CIMH
PRESENTATION OUTLINE • AIM AND OBJECTIVES OF THE RESEARCH • INTRODUCTION • FLOODING IN GUYANA • IMPACTS OF THE 2005, 2006 & 2008 FLOODS • RESEARCH METHODOLOGY • ANALYSIS OF RAINFALL DATA • RESULTS – RAINFALL DATA ANALYSIS • RESULTS – GOVERNMENT INVESTMENTS • CONCLUSION
AIM OF THE RESEARCH The aim of the research was to analyze the rainfall patterns associated with three flood events in 2005, 2006 and 2008 in Guyana and evaluate whether structural and non-structural investments made by the Government of Guyana after the 2005 flood mitigated the impact of the 2006 and 2008 floods.
OBJECTIVES OF THE RESEARCH The research sought to achieve the following objectives: 1. Analyze the rainfall patterns that influenced the 2005, 2006 and 2008 flood events; this included a comparison of the spatial and temporal rainfall variability that gave rise to the three flood events. In addition, this objective also included a characterisation of the antecedent moisture conditions before each of the flood events
OBJECTIVES OF THE RESEARCH 2. Assess the structural and non-structural investments made by the Government of Guyana (GOG) and Non Governmental Organisations (NGOs) toward flood mitigation subsequent to the 2005 flood and evaluate how these investments influenced the impact of the 2006 and 2008 floods. 3. Investigate how land-use practices may have changed before and after the 2005 flood and how these may have influenced the impacts of subsequent floods.
INTRODUCTION In January, 2005; February 2006 and December 2008 Guyana suffered three (3) of its most catastrophic flood events. These three events were particularly noticeable because they all caused significant damages and occurred in Guyana’s secondary rainfall season (mid-Nov to mid-Feb); rainfall amounts and intensities are generally expected to be less than the primary rainfall season (mid-Apr to mid-Jul).
INTRODUCTION All three (3) flood events impacted primarily Guyana’s Coastal Plain: • 10% of land space • 90% of total population • below mean sea level • most fertile lands • centre for agriculture (35% GDP), commerce, culture, education and communication • prone to (fluvial, pluvial and coastal) flooding Atlantic Ocean Venezuela Surinam Brazil
INTRODUCTION Flooding on the Coastal Plain is driven by: • Extreme rainfall • Proximity to the Atlantic Ocean and the EDWC • It’s below mean sea level and is subject to storm surges All three of these factors contributed to the three flood events in some way East Demerara Water Conservancy (EDWC)
RAINFALL EVENTS 2005 • Months prior to January, 2005 were dry • 87% of December, 2004 rain fell in the last 9 days • In January: • the 2, 3, 4 & 5-day rainfall records were exceeded • 30 year avg. of 185.2 mm was exceeded with 1108.2 mm surpassing the Dec.,1942 record of 1022 mm • There was a period of high tides during this time of heavy rains • EDWC overflowed its banks
RAINFALL EVENTS 2006 • Rainfall began on November 30, 2005 • The highest 1-day rainfall in Georgetown (147.6 mm) on Nov 30 • All stations along the coast exceeded their 30-year average in Dec • 22 consecutive rain-days in Dec • New 5-day maxima rainfall of 300.5 mm – surpassed 1942 record of 299.9 mm • In January, 2006 stations exceeded their 30-year average by 2 to 5 times
RAINFALL EVENTS 2008 • Rain began in early December, 2008 • On December 10 several stations recorded in excess of 50 mm with as much as 236.5 mm in one location. • Georgetown recorded 89.9 mm in 2.5 hrs and 115.5 mm in 24 hrs – the 9th • Most locations surpassed their 30-year average
SUMMARY OF FLOOD IMPACTS Source: ECLAC/Min of Agri
METHODOLOGY: Study Area Source: ECLAC Source: Bureau of Statsistics
METHODOLOGY: Data Collection • Desk Study: • Collection of reports and literature from which secondary data on the 2005, 2006 & 2008 were retrieved • This included environmental background data, rainfall distribution, weather reports, social and economic impact assessments of the floods, previous work, newspaper articles • Sources included: the Ministries of Agriculture, Education, Health; Guyana Red Cross; Parliament Library, etc.
METHODOLOGY: Data Collection Data collected included: • Daily rainfall data for thirty-eight (38) locations in the study area for the flood periods • Historical data for the 38 locations were collected for the computation of return periods • Interview of senior government officials to ascertain: - - the state of the drainage infrastructure prior to 2005 -- what investments were made after 2005 to reduce the impacts of future floods - investments made into infrastructural development
METHODOLOGY: Data Analysis Antecedent Moisture Condition: • An analysis of the rainfall data for two (2) months prior to the three flood events was done . The analysis included: - comparison of rainfall amounts with the 30-year average - the number of rain days (greater than 1 mm in 24 hrs) - the number of wet days (greater than 5 mm in 24 hrs) This analysis allowed for inferences on soil saturation levels and infiltration capacities immediately before the onset of the rainfall events that triggered the flooding.
METHODOLOGY: Data Analysis Rainfall data analysis: • Rainfall data for the three flood events for 38 stations within the study area were analyzed to determine the return period of the rainfall event at each location. The analysis included: - Simple Arithmetic Averaging to estimate missing data - Statistical tests to remove outliers (Grubbs-Beck Test) - Frequency Analysis/Gumbel plots to determine return periods for each flood event for the 38 locations
METHODOLOGY: Data Analysis Rainfall duration: • CIMH conducted a study in 2008 which showed that floods in Guyana are not always intensity-driven, but are more volumetrically-driven. • The study showed that even though the 2005 flood was the most catastrophic for Guyana the 24 hour rainfall was rarely in excess of 25 years for any location • This research used 7-day maxima rainfall with a 4-day overlapping window for each location to ascertain the return period
RESULTS: Antecedent Moisture BEFORE THE JANUARY 2005 FLOOD
RESULTS: Antecedent Moisture BEFORE THE JANUARY 2006 FLOOD
RESULTS: Antecedent Moisture BEFORE THE JANUARY 2008 FLOOD
RESULTS: Rain days BEFORE THE FLOODS
RESULTS: Wet days BEFORE THE FLOODS
RESULTS: Return Periods In general, Return Periods for 7-day maxima rainfall across the Study Area in 2005 was in the extreme range with the greatest return periods being 2500 years in Leonora Back, Region 3 and 1097 years in Georgetown. The Return Periods for 2006 and 2008 were noticeably less than 2005 for most locations.
RESULTS: Return Periods REGION 4
POST 2005 INVESTMENTS AFTER 2005 BEFORE 2005
POST 2005 INVESTMENTS BEFORE 2005 AFTER 2005
CONCLUSION • There were considerable spatial and temporal variation in the rainfall influencing the three flood events – the same general locations were not impacted by all three events • In 2005, the flood was triggered by a 7-8 day period of extreme rainfall • While the rainfall was extreme, it was also clear that the drainage infrastructure (including pumps and sluices) did not follow a strict maintenance schedule prior to 2005 • In 2006 and 2008 there were instances of extreme rainfall, but it was distributed over a of 2-3 week period prior to the flood events
CONCLUSION 5. There were considerable investments directed toward improving the drainage system after the 2005 flood – approx. 100 million US dollars from 2005 to 2009 6. There was uncertainty in the effectiveness of the investments in mitigating the impacts of the 2006 and 2008 for the following reasons: • the extensive variability of rainfall over the three flood events made comparison difficult • the areas where significant investments were made after the 2005 flood did not receive rainfall of a similar magnitude in 2006 and 2008
CONCLUSION • the floods of 2006 and 2008 were caused primarily by the release of water from the EDWC and therefore it was difficult to ascertain the contribution of direct rainfall 7. Flood insurance was proposed as a further safeguard for the physical infrastructure and livelihoods in light of the projected impacts of climate change.