
Employing Infrared Spectroscopy in the Resection of Gliomas: Insights and Future Directions
This study examines the application of infrared spectroscopy in the surgical resection of gliomas, focusing on the effects of high-intensity, low-frequency ultrasound on the spectroscopic signatures of tumor tissues. Our findings indicate a strong correlation between aspirated and bloc-resected tissue, suggesting that a real-time spectroscopic analysis during ultrasonic aspiration could provide valuable feedback to surgeons. While our results show specific absorption differences based on tumor grade, further research is needed to establish significant trends and validate the potential of this technique in clinical settings.

Employing Infrared Spectroscopy in the Resection of Gliomas: Insights and Future Directions
E N D
Presentation Transcript
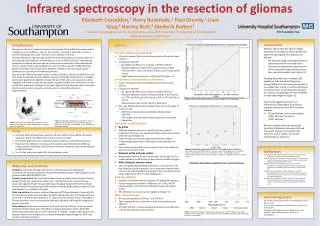
Infrared spectroscopy in the resection of gliomas Elizabeth Casselden,1 Harry Bulstrode,1 Paul Grundy,1 Liam Gray,2 Harvey Rutt,3 Diederik Bulters11Wessex Neurological Centre, Southampton, 2 Cardiff University, 3 University of Southampton Optoelectronics Department • Conclusions • We have shown that the effects of high intensity, low frequency ultrasound on the spectroscopic signature of gliomas are limited: • We showed a high correlation between aspirated and bloc-resected tissue. • Our spectra demonstrate the presence of the same lipid and protein bands as bloc-resected samples (as in figure 5). • Pending the production of statistically significant data demonstrating large enough differences between tissue types, it is possible that a device could be developed to analyse tissue in an ultrasonic aspirator as a means of supplying real-time feedback to operating surgeons (figure 2). • Our results suggest that there are differences in absorption from paired samples taken from solid HGG and their margins. • These differences were observed at 2850/1655cm-1 as well as 2959/1655cm-1. • We were unable show any previously described differences between HGG and low-grade tumours or normal brain. However with n values of 2, further investigation is required. • Results • The effect of ultrasonic aspiration: • 12 paired samples (bloc-resected and aspirated from the same tumour). • Comparison showed: • No significant difference in means at 2850/1655cm-1 • Absolute difference only 0.097 (aspirated mean±2SD: 0.465±0.288 vs .bloc resected 0.368±0.22, p=0.128, paired t-test). • High Pearson’s correlation, r=0.928, p<0.001 (figure 3). • Intratumoural and intertumoural differences: • 2 pairs of samples taken from different parts of the same tumour. • Comparison showed: • No significant difference in means at 2850/1655cm-1 • Absolute difference only 0.070 (mean±2SD: 0.857±0.032 vs. 0.787±0.066) and 0.001 (mean±2SD: 1.457±0.036 vs. 1.457). • Substantial overlap of error bars for both pairs. • One-way ANOVA demonstrated differences across the grade IV cohort (n=16). • Differences remain when justifiably outlying values excluded. • This might represent tumour heterogeneity or analytical limitations. • Differences at 2850/1655cm-1: • By grade • Although numbers were very small for all non-grade IV subgroups, there were no significant differences between mean values for grade (figure 4). • Grade IV tumours showed a skewed distribution. When considering median values, differences between grades are smaller. • More paired normal and tumour samples (n=2) are needed to show any consistent trend. • Between white and grey matter • White matter showed a lower mean value at this ratio (n=2): a counterintuitive result as this is lipid-rich and should be higher. • With astrocytictumours alone • After excluding oligodendroglialtumours, a trend in line with that found by previous groups is seen; astrocytictumours have a lower value (both median and mean) at this ratio than normal tissue. Differences did not reach significance. • Tumour margins: • Samples were taken from the margins of 4 high-grade gliomas. • Paired comparisons showed a difference of 0.143 (p=0.337, paired samples t-test) between marginal tissue and tumour proper. • The difference in means was not significant (figure 4). • Other reference peaks: • We examined peaks at 2929cm-1 and 2959cm-1. • These appeared more consistent in their wavenumber than 2850cm-1. • At 2929/1655cm-1, tumour margins demonstrated a difference of 0.709 (p=0.04) from normal tissue. • Otherwise no trends or significant differences were seen with grade. • Introduction • Gliomas are the most common primary brain tumour. Their infiltrative nature makes complete resection difficult, and yet ‘gross total’ resection is believed to confer a survival advantage of around 3 months over a subtotal resection. • Infrared absorption spectroscopy probes the molecular make-up of tissues based on their absorption at different wavenumbers; a ratio at 2850/1655cm-1 representing lipid:protein content has been shown to decrease incrementally from normal brain tissue to grade IV astrocytoma (figure 1), and may offer a means of differentiating grades of tumour and normal tissue. However, studies to date use small sample numbers that are not paired with normal brain. • Spectroscopic differences, particularly at tumour borders, offer the potential for real-time analysis dependent on the ability to easily and rapidly analyse tissue. A method of practical application might be through the use of the ultrasonic aspirator, used to fragment and remove tissue during surgery. Analysis of the tissue stream in real-time would offer immediate feedback to surgeons (figure 2), but depends on the assurance that the spectroscopic properties of tissue are not altered by ultrasonic fragmentation. • Aims • See if the infrared absorbance spectra of tissue collected through the ultrasonic aspirator closely resembles that of tissue resected en bloc. • See if these differences are maintained within tumours, and between patients. • Reproduce the differences in infrared absorption reported between differing tumour grades (including LGGs and non-astrocytic tumours) and tumour margins at 2850/1655cm-1. • See if other reference peaks offer discriminatory value. Figure 3:Scatter graph showing correlation between paired aspirated and bloc-resected samples. Pearson’s correlation coefficient r=0.928, p<0.001. n=12 in each group. Figure 2: A possible configuration of a device to attach to the ultrasonic aspirator. As tissue is drawn through the device, it is assessed by infrared light. There is potential for immediate feedback. Figure 1: Previous results published by Krafft et al, who demonstrated a decrease in the 2850/1655cm-1 absorption ratio with malignancy. References Sanai N, Berger MS. Glioma extent of resection and its impact on patient outcome. J Neurosurg 2008;62(4):753-766. Krafft C, Sobottka SB, Schackert G, Salzer R. Analysis of human brain tissue, brain tumors and tumor cells by infrared spectroscopic mapping. Analyst 2004;129:921- 925. Krafft C, Thummler K, Sobottka SB, Schackert G, Salzer R. Classification of malignant gliomas by infrared spectroscopy and linear discriminant analysis. Biopolymers 2006;82:301-305. Gaigneaux A, Decaestecker C, Camby I, Mikatovic T, Kiss R, Ruysschaert JM et al. The infrared spectrum of human glioma cells is related to their in vitro and in vivo behaviour. Exp Cell Res 2004;297:294-301. Ahmadi F, McLoughlin IV, Chauhan S, ter-Haar G. Bio-effects and safety of low-intensity, low-frequency ultrasonic exposure. Progress in Biophysics and Molecular Biology 2012;108:119-138. Figure 4: Graph of absorption at 2850/1655cm-1. There appears to be a trend to an increasing value at the 2850/1655cm-1 ratio with increasing malignancy (n=2 for normal tissue; n=2 for grade II tissue; n=4 for grade III tissue; n= 16 For grade IV tissue). Mean value for samples taken from the margins of HGG (n=4) appears lower than of solid tumour. Materials and methods Samples: were taken during surgery from consented patients undergoing craniotomy for suspected glioma in Wessex Neurological Centre. Ethical approval was granted under REC08/H0505/165. Sample preparation: Bloc-resected samples were cut from tumour destined for the histopathology lab. Aspirated samples were collected from the stream of tissue drawn through the Stryker Sonopet Ultrasonic Surgical System (UST-2001). Tissue was processed for spectroscopy in KBr pellets, with blank KBr pellets prepared in the same manner to establish a reference. Data acquisition: Data were collected through an FTIR spectrometer, Varian 600-IR in transmission mode, and assembled in Agilent Resolutions Pro v.5. Background was recorded at 20 scans/min, samples at 15 scans/min. Resolution of 4cm-1 throughout. The spectrometer was continuously purged with nitrogen, with regular background spectra recorded. Data analysis: Data were normalised to the peak around 1655cm-1 as per previous literature. Peak maxima were identified. Corresponding values from a blank KBr pellet were subtracted. Spectra were checked for ‘hidden’ peaks in the region of our maxima. Ratios were compared according to histopathological diagnosis. SPSS was used for statistical analyses. Acknowledgements Mr. Jonathan Duffill and the Wessex Neurological Centre theatre teams. Tess de Leon, Optoelectronics Department, University of Southampton. Dr. Sandrine Willaime-Morawek, Elodie Siney, Alex Holden, Clinical Neurosciences, University of Southampton. Figure 5: Example absorbance spectra from various tissues demonstrating the consistent presence of the various peaks, and our ability to at least reproduce spectra broadly comparable to those in the literature.


