Addressing Fuel Poverty and Energy Efficiency: Insights from Dr. Brenda Boardman
190 likes | 312 Views
In the 2014 update on fuel poverty, Dr. Brenda Boardman emphasizes the urgent need for improved energy efficiency in low-income households. Highlighting the significant gap between what fuel-poor households spend versus the national average, she advocates for a shift towards super energy-efficient, low-carbon housing. The report discusses local authority responsibilities, area-based approaches, and the necessity of minimum energy-efficiency standards. By focusing on community engagement and appropriate funding mechanisms, we can collaboratively tackle the intertwined issues of fuel poverty and climate change.

Addressing Fuel Poverty and Energy Efficiency: Insights from Dr. Brenda Boardman
E N D
Presentation Transcript
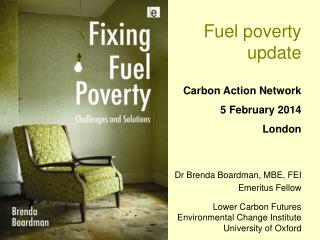
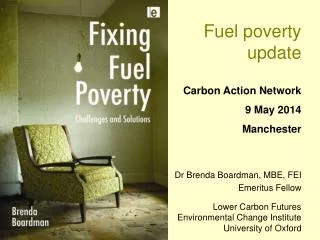
Fuel poverty update Carbon Action Network 7 October 2014 Coventry Dr Brenda Boardman, MBE, FEI Emeritus Fellow Lower Carbon Futures Environmental Change InstituteUniversity of Oxford
Income + housing Low income High income Energy inefficient housing Energy efficient housing
Households in fuel povertyEngland EBR and ACE (2014), Fuel poverty: 2014 update, p3-4
Fuel poverty gap The gap is the difference between the cost of what a fuel poor household should spend and the national average, both modelled Those in F- and G- rated properties: gap grew from £426 to £1068 in real terms 2003 : 2012 For 81,000 fuel poor households in G-rated properties the gap is £1,702 pa on average
Synergies: fuel poverty and climate change • Poorest people concentrated in worst housing • Upgrade to super energy-efficient, low-carbon housing • Climate change = SAP 100 @ 750,000 pa • Fuel poverty = Band C @ 500,000 pa
Reasonably practicable • ‘as many fuel poor homes as is reasonably practicable achieve a minimum energy efficiency standard of Band C, by 2030’ • Children’s Act: a ‘lack of resources’ is not the justification • The aim should be 95% of homes (EFPC)
Why do people say ‘No’? • Take-up rate: • First visit = 15-50% • Over time = 95% (several years) • Just not the right moment - could be later • Fear and worry: will be worse than before • Hate intrusion, people in the home, disruption
Local Authority tasks • HHSRS / minimum standards – no F and G-rated properties • Health and Wellbeing Boards • HECA • Landlord register • Complete EPC coverage • Decent Homes 2
Rates of insulation EBR and ACE (2014), Fuel poverty: 2014 update, p7
Area based approaches • Low Carbon Zones (Warm Zone +) • One (or more) per local authority • Local authority co-ordinates • Works closely with community groups • Street-by-street • Focused on poorest housing • SAP 81 or better (A/B on EPC)
Working with communities • Community groups act as go-between • Protect and speak for low-income residents • Arrange advice and non-standard measures • Are trusted • Help incorporate all households
Methods of funding policies • Through utility bills = EUETS, RO, FIT, ECO, WHD • Regressive for the fuel poor as a group • Particularly regressive for fuel poor who pay, but do not receive • From taxes = RHI, WFP • Progressive – many fuel poor do not pay income tax • Benefits disproportionately to the rich • Through regulation • Property owner responsible • Opposite of privately rented consultation • Brings in some private money
Annual cost to individual customers of utility programmes (2013) (pre VAT) • In 2014, perhaps £120 for fuel poor out of £1000 (12%) inc VAT
Some other issues • Responsibilities of property owners for energy efficiency • Mandatory minimum energy-efficiency performance standards for housing • Starting with privately-rented sector • Take an aggressive stance on improving the energy efficiency of the homes of the fuel poor / low income • Subsidise if necessary through the Treasury’s infrastructure fund, for instance instead of roads, especially capital expenditure = cheaper finance
www.eci.ox.ac.uk Thank you
Workshop questions Assumes some money available • Area-based approaches – what size? COA as in NI (150 households) • How to link with local community groups? • How to employ local installers? • Property owner vs occupant? • How to link with HECA and HHSRS?