
Introduction
Regional Boundary. State Boundary. Crops. Feed Mill Farm. Soil. Animals. Global. Inorganic P Sources. People. Manure. Manure. Fertilizer. Crops. Cropland. Cropland Nutrient Budgets in the Mid-Atlantic Region: Information as Basis for Change

Introduction
E N D
Presentation Transcript
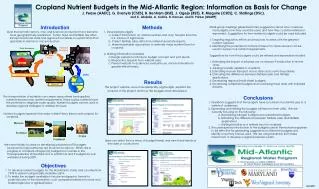
Regional Boundary State Boundary Crops Feed Mill Farm Soil Animals Global Inorganic P Sources People Manure Manure Fertilizer Crops Cropland Cropland Nutrient Budgets in the Mid-Atlantic Region: Information as Basis for Change J. Pease (AAEC), G. Evanylo (CSES), B. Benham (BSE), J. Ogejo (BSE), R. Maguire (CSES), C. Stallings (DSc), and C. Abdalla, A. Collins, D. Hansen, and D. Parker (MAWP) • Introduction • Over the last half-century, crop and livestock production have become more geographically separated. Today, feed and fertilizer are often transported across state and regional boundaries to sustain farms that specialize in animal or crop production. • Methods • 1. Developing budgets • a. Collect information on animal numbers and crop harvests from the U.S. Census of Agriculture. • b. Collect fertilizer sales data from national and state reports. • c. Make reasonable assumptions to estimate major nutrient flows for cropland. • 2. Making information available • Design website to introduce budget concept and post results. • Respond to requests from website users. • Present website to audiences, evaluate use, and re-formulate for greater effectiveness. • Small-group meetings generated many suggestions about who could use the budgets, how they could be used, and how they could be refined or expanded. Suggestions for how nutrient budgets could be used included • Targeting regulatory efforts and resources to areas with the greatest nutrient surpluses. • Identifying the potential for manure transport to areas where it can be used to supply crop nutrient requirements. • Suggestions for how the budgets could be refined and expanded included • Estimating the impact of phytase use on manure P production in recent years. • Adding biosolids applied to cropland. • Estimating manure transport across state and county boundaries. • Estimating the difference between fertilizer sales and fertilizer applications. • Developing regional (multi-state) budgets. • Developing watershed budgets and overlaying these data with impaired streams. • Results • The project website, www.mawaterquality.org/budget, explains the purpose of this project and how the budgets were developed. • This transportation of nutrients can create areas where land-applied nutrients exceed crop nutrient requirements. These surplus nutrients have the potential to degrade water quality. Nutrient budgets can be used to develop regional strategies to address this issue. • Conclusions • Feedback suggests that the budgets have a number of potential uses to a variety of audiences. • Expanding and refining the budgets will improve their utility. We are currently focusing on the following: • Developing nitrogen budgets and watershed budgets. • Estimating the differences between fertilizer sales and fertilizer applications. • Adding biosolids as a nutrient input to cropland. • The participatory introduction to the budgets used in Pennsylvania appears to be effective for generating suggestions to refine the budgets and identify ways they can be used. We are using feedback from these interactions to develop a regional extension plan. • Nutrient budgets represent the major nutrient flows (inputs and outputs) for cropland. • Users can select from a menu of budget trends and view these trends at the state or county level. • We have initially focused on developing phosphorus (P) budgets because its major pathways are those shown above. Efforts are in progress to complete nitrogen (N) budgets for counties in the Chesapeake Bay Watershedand to partition N and P budgets by sub-watershed during 2007. • Objectives • To develop nutrient budgets for the Mid-Atlantic states and counties from 1978 to present using readily-available data. • To make the budgets available in tabular and graphic format to potential users of the information, such as representatives from state and federal agencies or agribusinesses. Feb 2007


