Download
1 / 20
200 likes | 207 Views
This study conducted by Guy Schott, P.E., explores the hydraulic efficiency and disinfectant exposure time of water through an ozone contactor at Modesto Irrigation District's treatment plant. The study used fluoride as a tracer and analyzed the results using specific equipment and methods.

E N D
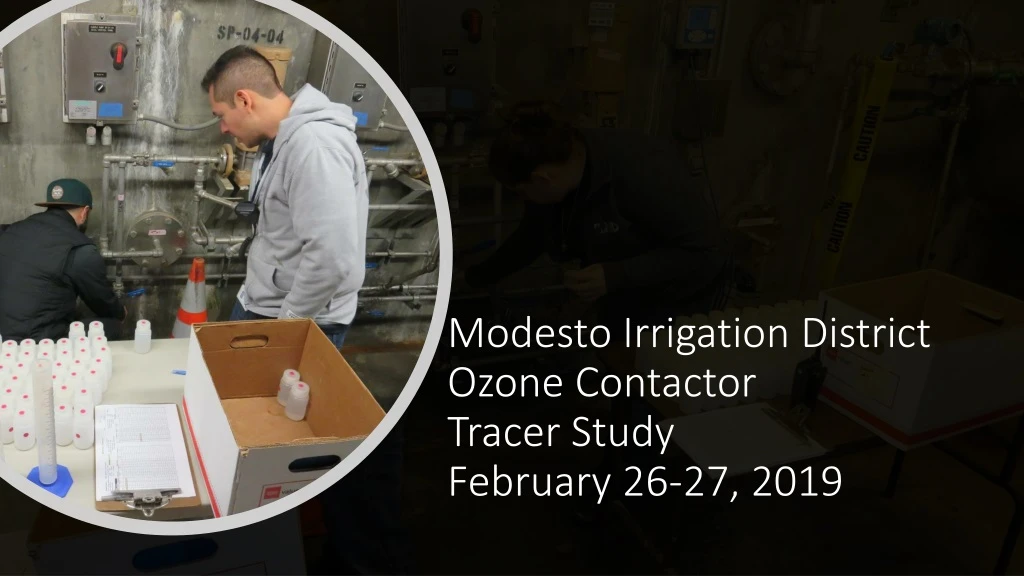
Modesto Irrigation District Ozone Contactor Tracer StudyFebruary 26-27, 2019
Modesto Irrigation DistrictCA5010038Tracer Study – Ozone ContactorFebruary 26-27, 2019 Tracer Study: Treatment Plant: Membrane Plant Reactor: Ozone Contactor Serpentine: 4 Channels Volume: 183,000 gallons Tracer Method: Slug-Dose Tracer: Fluoride (liquid) Fluoride Mass Added: ~1,400 grams Test Flows: 10.2 & 19.9 MGD Performed by: Guy Schott, P.E. CA Division of Drinking Water
Table of Contents • Summary of Tracer Results • Ozone Reactor Design • Tracer Injection Location • Graphs 1-5: Stations 3-5, 10.2 & 19.9 MGD, Slug-Dose Curves • Purpose of a Tracer Test • Disinfection Exposure Time of Fluid in Vessel for Determining Ct10 • Ct10 Value • Baffling Factor (BF) • Tracer Test Method (Slug-Dose) • Method of Analysis and Equipment
Modesto Irrigation District - Tracer Results #1 *Recommend to discard this data due to short HRT that may have resulted in inadequate mixing.
Modesto Irrigation District - Tracer Results #2 Working ozone contactor volume: 138,000 gallons.
Sample Stations Three samples stations (#3, 4 & 5). Sample frequency were at 0.5, 1, & 2 minutes. Station #5 Station #4 Station #3
Purpose of a Tracer Study • To determine the hydraulic efficiency or disinfectant exposure time of water through one or more reactors. • The addition of known quantities of a nonreactive chemical (tracer) is added in the form of a pulse (slug) or step-input. • The time of travel or disinfectant exposure time through the reactor is related to: • Flow rate • Reactor water volume • Water Depth • Reactor configuration
Disinfection Exposure Time of Fluid in Vessel for Determining Ct10
Ct10 Value - Log inactivation is based on the Delivered Dose, “Ct10” “C” is the disinfectant residual (mg/L) “t10” is the exposure or contact time (minutes) Multiply them: C•t10= mg/L • min (delivered dose) The calculated Ct10 value is looked up in EPA Cttables to determine the log inactivation based on specific monitoring parameters (pH, disinfectant residual and/or temperature).
Baffling Factor (BF) • Baffling factor or short-circuiting factor: • Determined from tracer study or estimated • BF = t10/ HRT from tracer study • HRT (hydraulic residence time) = reactor volume divided by reactor flow • Once the BF is determined, then it is applied to the operations of the reactor for determining the disinfectant exposure time. Example: • Ozone reactor operating volume: 183,000 gallons • Exit flow: 7,000 gpm • BF: 0.70, from tracer study • Calculated contact or disinfection exposure time: • 183,000 gal ÷ 7,000 gpm × 0.70 = 18.3 minutes = t10
Test Method Slug-Dose or Pulse-Input Method • Adding the entire amount of tracer at the beginning of test. The reactor outlet tracer concentration is monitored for 3-4 HRT to determine mass recovery and the time (t10) it takes for 10% of the tracer mass to exit the reactor.
Method of Analysis and Equipment • Intellical™ ISEF121 Fluoride (F-) Ion Selective Electrode (ISE) • HQ40d Portable ISE Multi-Parameter Meter • Fluoride Ionic Strength Adjustor (ISA) • Fluoride Standards (0.2/2.0 & 0.5/ 5.0 mg/L) • 50 mL graduated cylinder • Finnpipette F2 variable volume pipette, capacity 0.5 - 5 mL • Electrode stirrer stand • 50 mL beakers • Stir Bar, Magnetic, Polygon
Contact • Guy Schott, P.E. • State Water Resources Control Board • Division of Drinking Water • Santa Rosa, CA • Guy.Schott@waterboards.ca.gov • 707-576-2732