Download
1 / 39
390 likes | 524 Views
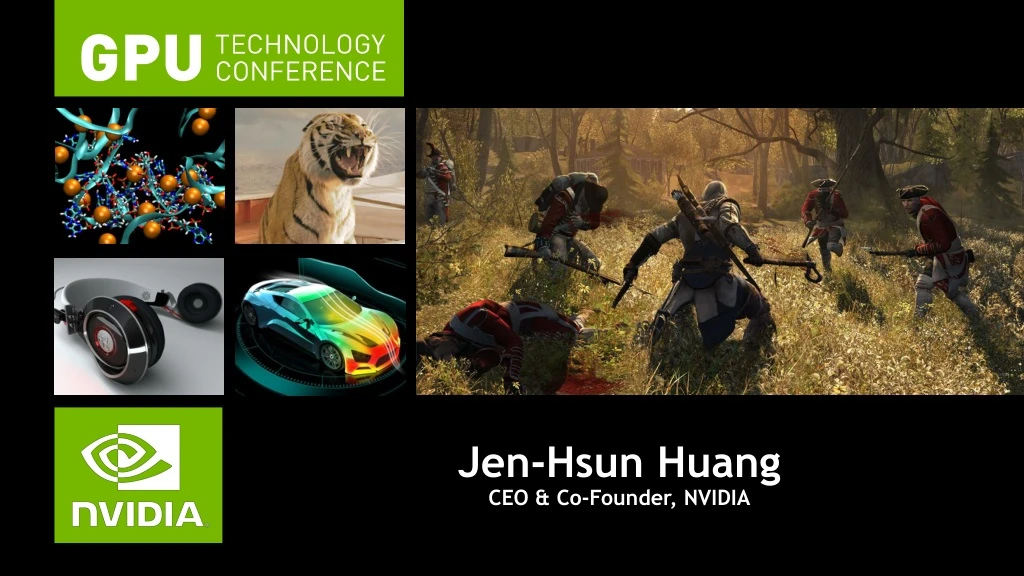
CEO Jen-Hsun Huang shares record revenues, business growth, and "light every pixel" strategy for 2014. Here, you'll find details about how NVIDIA expands its visual computing technology for enterprises and progresses portable gaming with SHIELD.

E N D
Jen-Hsun Huang CEO & Co-Founder, NVIDIA
Safe Harbor Except for the historical information contained herein, certain matters in this presentation including, but not limited to, statements as to: our investments and opportunities; our financial results; the performance and benefits of our products and technologies; our strategies; and other predictions and estimates are forward-looking statements within the meaning of the Private Securities Litigation Reform Act of 1995. These forward-looking statements and any other forward-looking statements that go beyond historical facts that are made in this presentation are subject to risks and uncertainties that may cause actual results to differ materially. Important factors that could cause actual results to differ materially include: global economic conditions; our reliance on third parties to manufacture, assemble, package and test our products; the impact of technological development and competition; development of new products and technologies or enhancements to our existing product and technologies; market acceptance of our products or our partners products; design, manufacturing or software defects; changes in consumer preferences and demands; changes in industry standards and interfaces; unexpected loss of performance of our products or technologies when integrated into systems and other factors. For a complete discussion of factors that could materially affect our financial results and operations, please refer to the reports we file from time to time with the SEC, including our Form 10-K for the fiscal year ended January 27, 2013. Copies of reports we file with the SEC are posted on our website and are available from NVIDIA without charge. These forward- looking statements are not guarantees of future performance and speak only as of March 19, 2013, based on information currently available to us. Except as required by law, NVIDIA disclaims any obligation to update these forward-looking statements to reflect future events or circumstances.
Achieved record revenues, margins and cash Grew GPU and Tegra processor businesses Reached tipping point for GPU-accelerated computing Introduced Tegra 4 with integrated 4G/LTE Invented GRID — A new server GPU platform FY13 Fighting through the Headwinds
Fiscal 2013 Performance Record Revenue Record Cash 3.7 4.0 +19% 5.0 +7% 4.3 3.1 4.0 4.0 3.0 Billions Billions 3.0 2.0 2.0 1.0 1.0 FY12 FY13 FY12 FY13 Record Tegra (Smartphones & Tablets) Record Gross Margin 52.9% 52.9% 55% 600 540 51.8% +50% 50.1% 50% Millions 360 45% 350 40% 35% 100 FY12 FY13 Q1FY13 Q2FY13 Q3FY13 Q4FY13 Based on GAAP Results
Consistent Financial Performance GPU Growth Leveraging R&D for Income Growth (non-GAAP) 3.5 3.2 OM% OPEX% COGS% 3.0 100% 2.7 2.3 Billions 47% 48% 75% 2.5 55% 61% 50% 31% 1.5 33% 31% 25% 31% 21% 20% 14% 8% 0.5 0% FY10 FY11 FY12 FY13 FY10 FY11 FY12 FY13 Record Gross Margin (non-GAAP) Cash Generation 3.7 55% 52.3% 4 51.9% 3.1 % of Revenue 50% 3 45.1% 2.5 Billions 45% 1.7 2 39.0% 40% 1 35% 30% 0 FY10 FY11 FY12 FY13 FY10 FY11 FY12 FY13 Based on non-GAAP Results which excluded stock-based compensation, amortization of acquisition-related intangible assets, other acquisition-related costs, a charge related to a tender offer purchase in fiscal 2010, charges related to the weak die/packaging material set, net of insurance reimbursement, in fiscal years 2011 and 2010, a legal settlement charge in fiscal 2012, and a contribution expense in fiscal 2013
Strong position in GPU Leverage GPU, launch GRID into new $5B+ TAM Engage LTE market with Tegra 4 and 4i — projected to triple to 500Mu/yr by 2017 Tegra traction in mobile, tablets, PC, gaming devices, auto, and embedded Investment quadruples NVIDIA TAM to $20B+ FY14 New Products New Markets Gearing Up for Growth
NVIDIA THE VISUAL COMPUTING COMPANY
NVIDIA The Visual Computing Company VISUAL COMPUTING APPLIANCE TECHNOLOGY PROCESSORS
A Computing Revolution 100% 90% 80% 70% OS Market Share 60% 50% 40% 30% 20% 10% 0% 1993 1998 2003 2008 2013 Source: Gartner, Strategy Analytics
Computing Everywhere 5 100% 4 80% Processor Shipments (Billions) Processor Market Share 3 60% 2 40% 1 20% x86 and Cortex Processors Shipped 0 0% 1993 1998 2003 2008 2013 Source: Mercury Research, ARM, Internal estimates
Investments & Opportunities Smartphone Tablets WinRT PCs Auto Gaming Devices 500M LTE devices (by 2017 – 3X 2013) ~$10B 200M Android & WinRT tablets 50M cars w/ infotainment & cluster 20M mobile gaming devices ~$5B GRID 160M enterprise workers @ 8ccu = $20B/4y ~$1B Tesla 50M game subscribers @ 5ccu = $10B/4y 10M designers @ 1ccu = $10B/4y GeForce Quadro ~$5B Tegra ~$600M ~$1B GPU INVESTMENT TAM
Investments & Opportunities REVENUES Smartphones Tablets WinRT PCs Auto Gaming Devices ~$10B $764M $156M ~$5B GRID ~$1B Tesla $3.2B $2.3B GeForce Quadro ~$5B Tegra ~$600M ~$1B GPU INVESTMENT TAM FY10 FY13
GRID Leveraging our graphics & GPU expertise, invent new technologies that can extend our GPUs into servers, datacenters, and appliances.
Key Components of GRID GRID VGX Software GRID GPUs GRID VCA Visual Computing Appliance
Enterprise Computing Strategy Industry’s most trusted graphics partner | Deep optimization with ISVs End-to-end visual computing solution GRID VGX GRID VGX QUADRO Workstations GRID TEGRA | GEFORCE Devices Enterprise Server DESIGN SIMULATION COLLABORATION SALES & MARKETING
Remote GPU-Accelerated Workspace GRID available to ALL 16 Concurrent Users
NVIDIA GRID A Visual Computing Appliance CISCO ROUTER A Networking Appliance NVIDIA GRID A Visual Computing Appliance NETAPP NAS A Storage Appliance
NVIDIA GRID VCA BASE $24,900 + $2,400/yr SW license (unlimited devices) MAX $39,900 + $4,800/yr SW license (unlimited devices) Kepler GPUs (4GB FB ea) CPU Threads System Memory 8 16 16 32 192 GB 384 GB
GRID Milestones Q1 Q2 Q3 Q4 6 Partners 20 Trials Production GRID Gaming VDI & OEM partners Production 75 Trials GRID Enterprise GRID VCA & ISVs Announcement 15 Trials VAR Program Launch Production GRID VCA
TEGRA Leveraging our GPU assets & expertise, invest to be a major player in a world where “visual computing is everywhere”.
2013 1st Quad Core A15 1st Always-On HDR Camera 1st LTE SDR Modem 1st Quad Core 1st Battery Saver Core 1st WinRT Tablet Tegra Firsts 2012 1st Dual Core 1st Honeycomb 1st Game Store — TegraZone 2011
Mobile Computing Innovation A15 A15 4+1 PRISM 2 FRAME DISPLAY A15 A15 BEST PERFORMANCE LONGEST BATTERY LIFE Chimera Architecture TEGRAZONE S I G C ENGINE MEMORY BEST GAMING INNOVATIVE CAMERA INTEGRATE INDUSTRY LEADING CPU, GPU, CAMERA, LTE MODEM
Tegra 4 5W TDP Tegra 4i 1W TDP Tegra 4 Family “ Based on these estimates, even Qualcomm’s best processor, which is due to enter production at about the same time as Tegra 4, won’t surpass Nvidia in these tests. “ Quad CPU A15 4+1 A9 r4 4+1 NVIDIA GPU 72 Core 60 Core i500 dedicated integrated CHIMERA Photo Architecture
SUPERPHONES FOR THE MAINSTREAM Tegra 4i | 5” 1080p Display | 8mm Thin | 4G LTE PRISM 2 | DirectTouch | Chimera Camera Phoenix Reference Phone Platform
Icera Modem Milestones Certified at 95 carriers in 65 countries | 20M modems shipped to date 1st WinRT LTE multi-mode modem certified at AT&T CAT4, CA, VoLTE 1st LTE CAT3 Multimode AT&T I500 Sampling 1st HSPA+ Phones HSPA+ T-Mobile US HSPA Vodafone Global HSUPA AT&T HSDPA SoftBank Japan 2006 2007 2008 2009 2010 2011 2012 2013 i150 i300 i400 i500
PROJECT SHIELD “ Project SHIELD is a major disruption to portable game devices, game consoles and devices like the Apple iPod. ” “ NVIDIA has built what could be the most compelling portable game system in some time. ”
TEGRA Best in Graphics — Best for Gaming
Tegra Milestones Q1 Q2 Q3 Q4 Q1 (2014) SHIELD Production Phones/Tablets Production Tegra 4 Carrier Certifications Begin Tablets Production i500 Carrier Certifications Begin Mainstream Smartphones Production Tegra 4i
Gearing Up for Growth ~$10B ~$5B ~$1B ~$5B Tegra ~$600M ~$1B GPU INVESTMENT TAM
RECONCILIATION OF NON-GAAP TO GAAP FINANCIAL MEASURES Stock-based compensation (a) Acquisition- related items (b) Net warranty charges (c) Other (d) Non-GAAP GAAP FY2010 Revenue Cost of goods sold Gross profit Operating expense Operating income (loss) $ 3,326 $ 2,030 $ 1,296 $ 1,041 $ $ $ $ $ $ (247 ) - $ $ $ $ $ - - - $ $ $ $ $ - $ $ $ $ $ - - - - - $ 3,326 $ 2,149 $ 1,177 $ 1,276 $ (99 ) 23 96 (23 ) 224 (96 ) (2 ) (94 ) 13 255 (13 ) FY2011 Revenue Cost of goods sold Gross profit Operating expense Operating income $ 3,543 $ 1,945 $ 1,598 $ 1,096 $ $ $ $ $ $ (100 ) - 8 (8 ) 92 $ $ $ $ $ - - - 9 (9 ) $ $ $ (181 ) $ $ (194 ) - $ $ $ $ $ - - - $ 3,543 $ 2,134 $ 1,409 $ 1,153 $ 181 13 (57 ) 57 502 256 FY2012 Revenue Cost of goods sold Gross profit Operating expense Operating income $ 3,998 $ 1,923 $ 2,075 $ 1,246 $ $ $ $ $ $ (136 ) - $ $ $ $ $ - - - $ $ $ $ $ - - - - - $ $ $ $ $ - 7 (7 ) - (7 ) $ 3,998 $ 1,941 $ 2,057 $ 1,409 $ 11 (11 ) 125 38 829 (38 ) 648 $ in millions
RECONCILIATION OF NON-GAAP TO GAAP FINANCIAL MEASURES Stock-based compensation (a) Acquisition- related items (b) Net warranty charges (c) Other (d) Non-GAAP GAAP FY2013 Revenue Cost of goods sold Gross profit Operating expense Operating income $ 4,280 $ 2,043 $ 2,237 $ 1,396 $ $ $ $ $ $ (137 ) - $ $ $ $ $ - - - $ $ $ $ $ - - - - - $ $ $ $ $ - - - $ 4,280 $ 2,054 $ 2,226 $ 1,578 $ 11 (11 ) 126 36 20 841 (36 ) (20 ) 648 Footnotes (a) In addition to our historical practice of excluding stock-based compensation, during FY10, the Company completed a tender offer to purchase outstanding stock options which resulted in a charge of $140.2 million. This charge was allocated to cost of goods sold, research and development expense, and sales, general and administrative expense, of $11.4 million, $90.5 million and $38.3 million, respectively. (b) Acquisition-related items are comprised of amortization of acquisition-related intangible assets and other acquisition-related costs such as transaction costs, compensation charges and restructuring costs relating to the acquisitions. (c) Net warranty charges are comprised of charges to cost of goods sold related to the weak die/packaging material set that was used in certain versions of our previous generation chips and a charge to operating expense related to a class action lawsuit settlement, net of insurance reimbursement. (d) Other is comprised of legal settlement charges and benefits and the net present value of a charitable contribution. $ in millions
RECONCILIATION OF OTHER FINANCIAL MEASURES FY2010 FY2011 FY2012 FY2013 Graphics Processing Unit (GPU) Revenue excluding chipset products Chipset product revenue GPU Revenue $ 2,299 $ $ 3,171 $ 2,659 $ $ 3,346 $ 2,990 $ $ 3,187 $ 3,228 $ $ 3,252 872 687 197 24 $ in millions