Download
1 / 32
320 likes | 474 Views
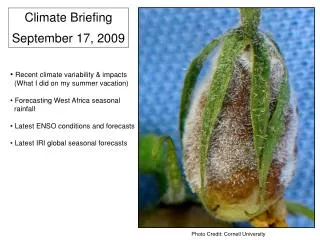
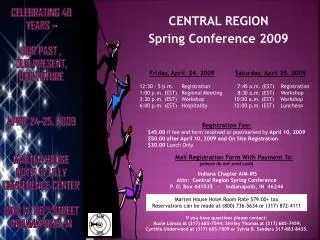
All Things TAF A Briefing to Central Region September 24, 2009 Chuck Kluepfel National Weather Service Headquarters Silver Spring, Maryland 301-713-0090 x132 Charles.Kluepfel@noaa.gov Prepared October 2008. TAF System Objectives. Verify all terminals with a TAF

E N D
All Things TAF A Briefing to Central Region September 24, 2009 Chuck Kluepfel National Weather Service Headquarters Silver Spring, Maryland 301-713-0090 x132 Charles.Kluepfel@noaa.gov Prepared October 2008 1
TAF System Objectives • Verify all terminals with a TAF • More continuous – Every 5 minutes • Scheduled TAFs/ Amendments / Both • Evaluate TEMPO / PROB groups • Combine CIG and VIS into one element • Called: Flight Category • Example: < 1000 feet or < 3 miles • Compare TAF to MOS or persistence 2
Part 1 TEMPO Forecasts Are we serving the people who use our forecasts? 3
Is a TEMPO Group Justified? Variability Test Look at every 5 minutes of the TEMPO. Look for two or more changes +/- 90 minutes. Definition of “Change” Sig Wx Types: Beginning or end of an event Ceiling / Visibility: Defined categorically 4
Visibility > 5 statute miles 3 to 5 miles 2 to < 3 miles 1 to < 2 miles ½ to < 1 mile < ½ mile Ceiling > 3000 feet 2000-3000 feet 1000-1900 feet 500-900 feet 200-400 feet < 200 feet Ceiling and Visibility CategoriesAll Ceiling or visibility changes are defined categorically 5
KABC 301728z 301818 24010KT P6SM SCT030 TEMPO 1820 1SM +TSRA BKN008CB FM2100 VRB05KT P6SM SKC= Question: If it only thunders for 15 minutes out of 2 hours (the length of my TEMPO group), will my False Alarm Ratio be 1 hour 45 minutes = 0.88 ? 2 hours 6
KABC 301728z 301818 24010KT P6SM SCT030 TEMPO 1820 1SM +TSRA BKN008CB FM2100 VRB05KT P6SM SKC= Answer: Absolutely not! We do not compute False Alarm Ratios (FAR) from the TEMPO forecast, alone. TEMPOs are not intended to be applied to the entire TEMPO period. We only compute FARs for the Prevailing Forecast “Operational Impact” Forecast 7
Obs’n Prevail TEMPO Pass VAR Test? OIF 1635 No TS . . . . 1805 No TS No TS TS Yes No TS . . . . 1905 No TS No TS TS Yes No TS 1910 TS No TS TS Yes TS 1915 TS No TS TS Yes TS 1920TS No TS TS Yes TS 1925 No TS No TS TS Yes No TS 1930 No TS No TS TS Yes No TS . . . . 1955 No TS No TS TS Yes No TS 2000 No TS No TS TS Yes No TS TAF Example 1 8
Thunderstorm TEMPOs Central Region All Scheduled TAFs 0-6 hour forecasts * FY09 through September 21, 2009 9
Fog (BR and FG) TEMPOs Central Region All Scheduled TAFs 0-6 hour forecasts * FY09 through September 21, 2009 11
Ceiling TEMPOs Central RegionAll Scheduled TAFs 0-6 hour forecasts * FY09 through September 21, 2009 12
Visibility TEMPOs Central RegionAlll Scheduled TAFs 0-6 hour forecasts * FY09 through September 21, 2009 13
Part 2 Traditional Statistics 14
Review • POD is an event-based statistic • For TAFs, IFR and below usually define the event. • It is the percentage of total “events” that hit. • It is alternatively called the hit rate. • FAR is a warning-based statistic • Any forecast of IFR or below defines the “warning.” • FAR is the percentage of time that the forecaster false alarms for IFR or below. 15
Review • You can drive your POD up by over-forecasting IFR and below conditions. • However, this practice will also drive up your FAR. • The CSI provides a mathematical way of correcting the POD for a high FAR. (It adds the number of false alarms to the denominator). 16
Operational Impact Forecast (OIF) • When there is no TEMPO forecast: • OIF is set equal to the prevailing forecast. • When TEMPO passes variability test: • Two forecasts are in effect simultaneously. • OIF is set equal to forecast with the least error. • When TEMPO fails variability test: • Two forecasts are in effect simultaneously. • OIF is set equal to the forecast with the worst conditions. • This rule usually, but not always, lowers the OIF. 17
Central Region FY09*Flight Category: IFR and Below * FY09 through September 21, 2009 18
Central Region FY09*Flight Category: IFR and Below * FY09 through September 21, 2009 19
Central Region FY09*Flight Category: IFR and Below * FY09 through September 21, 2009 20
Central Region FY09*Flight Category: IFR and Below * FY09 through September 21, 2009 21
Central Region FY09*Flight Category: IFR and Below * FY09 through September 21, 2009 22
Central RegionFlight Category: IFR and BelowWarm Season FY09* (April 1 to September 21, 2009) * FY09 through September 21, 2009 23
Part 3 Lead-Time Software 24
Part 4 The Future 26
The Future Output to CSV files Starting with Flight Category and Sig Wx Data Ceiling / Visibility (next) Winds (last) Plots of POD / FAR / CSI Sort Elements by Sig Wx Type 27
Improving the Current System: Geometric Interpretation (X) FOH FAR (Z) 1 FOM (Ma,Mf) PON Ma: Average of Observations (x+y)/N Mf: Average of Forecasts (x+z)/N FORECAST (F) POD POFD 0 (W) (Y) DFR FOCN 1 0 OBSERVED (A) A(F): Regression of Observations upon the forecast F(A): Regression of Forecast upon observations
Basic Interpretation: Extreme Cases PERFECTFORECAST RESIGN FROM THE NWS 29
Basic Interpretation: Random Chance RANDOM CHANCE 30
Basic Interpretation: False Alarms vs. Misses Over-forecast Under-forecast Assesses Bias in one glance!! 31
The Future Output to CSV files Starting with Flight Category and Sig Wx Data Ceiling / Visibility (next) Winds (last) Plots of POD / FAR / CSI Sort Elements by Sig Wx Type 32