Download
1 / 18
180 likes | 339 Views
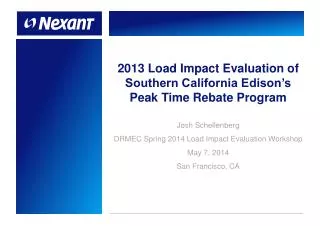
2013 Statewide BIP Load Impact Evaluation. Candice Churchwell DRMEC Spring 2014 Load Impacts Evaluation Workshop San Francisco, California May 7, 2014. Presentation overview. Introduction Load impact evaluation methodology and validation Ex post results Ex ante results.

E N D
2013 Statewide BIP Load Impact Evaluation Candice Churchwell DRMEC Spring 2014 Load Impacts Evaluation Workshop San Francisco, California May 7, 2014
Presentation overview • Introduction • Load impact evaluation methodology and validation • Ex post results • Ex ante results
BIP is a statewide emergency demand response program • BIP is the Base Interruptible Program – an emergency demand response program offered by all three electric IOUs • BIP is tariff-based and is activated by the IOUs in the event of a CAISO or local system emergency • Participants receive incentive payments in return for their obligation to reduce electricity usage to a certain level – the Firm Service Level – when BIP events are called • Participants who fail to reduce load down to or below their FSL are subject to a financial penalty assessed on a per kWh basis BIP Enrollment Since 2008 BIP enrollment is concentrated at Edison • SCE enrollment has been steady • PG&E enrollment has grown • SDG&E enrollment has declined
BIP as implemented across the three electric IOUs • Available to both IOU customers and aggregators • Participation requires a minimum load drop of 100 kW, where the load drop is at least 15% of maximum demand • PG&E and SDG&E provide at least 30 minutes’ notice of events, SCE has an option for 15-minute notification • The maximum event length at PG&E and SDG&E is 4 hours and 6 hours at SCE • All BIP tariffs provide for at least one annual test event where penalties can apply • Incentives and penalties can vary by size of load drop, service voltage and season Example participant receiving service at 2 kV that drops 500 kW with 30-minute notice during a summer event
PG&E and SDG&E have taken new steps to discourage non-performance PG&E • Participants that do not reduce load down to or below their FSL can be subject to a retest event, and the noncompliance penalty increases to $8.40 per kWh • If a customer does not comply during an event, PG&E may reset their FSL, retest the customer at their current FSL or terminate the customer’s participation SDG&E • SDG&E now requires BIP applicants to submit load reduction plans and will be tested for their ability to comply • SDG&E also resets FSLs of those customers who fail to comply with their commitment to the demand level achieved during the event All IOUs permit participants to make FSL changes or unenroll once a year in November
The key to estimating BIP load impacts is estimating what participants’ load would have been without an event • We can see directly what DID happen on event day, but not what would have happened if the event did NOT occur • Estimating how much load reduction the program delivered in 2013 requires estimating the reference load • A number of analytic possibilities exist: • Baselines • Matched control groups • Individual customer regressions
Our methodology choice is informed by the combination of program and customer characteristics unique to BIP • BIP customers are typically very large and have complex industrial business processes • Baselines would be a poor choice for many BIP customers with business processes that depend on month and day of week. Inferring Friday’s load using the Monday through Thursday load could be like comparing apples and oranges! • Targeting the hottest days out of the recent past is also a poor choice because BIP participants’ load is not very weather sensitive • BIP event-like days aren’t hard to find • Unlike a program like CPP where eventdays are special, there are many days of the year available to inform what BIP participants’ load would have been on event day. Within-subjects analysis such as individual customer regressions can perform well is this case • But BIP-like customers could be hard to find • Selecting a control group for this DR program that includes some of the biggest customers in each IOU’s service territory would be difficult
We estimate reference load with a regression model for each BIP participant • Many caveats for within-subjects estimation are not a problem here • Capturing day-of-week and seasonal influences on electricity use is important • While accuracy for any individual customer may not be fantastic, across the program individual regressions can perform very well PG&E’s Reference Load Model
One model specification is used for each IOU • We tested 11 model specifications for each IOU • Only PG&E got a new model this year • We tested whether to use 1 or 2 years of historical data • SCE was the only IOU where we used 2 years of data • We also tested whether to include weekends in the model or not
Model validation included out-of-sample testing and checks on goodness-of-fit Out-of-sample Testing • Since ex ante estimates are geared towards hot days, we use the top nine system load days for out-of-sample testing • Difference in between actual and predicted load does not exceed 13% in any hour for any IOU • Excluding SDG&E, the difference between actual and predicted load does not exceed 4% in any hour • There’s only 7 SDG&E participants so the SDG&E BIP estimates aren’t as accurate • Unadjusted R-squared statistics are reasonable for this customer class Unadjusted R-squared
Ex ante estimation requires estimating over/under performance relative to the FSL • Most DR programs require applying ex post load impacts to reference load predicted for ex ante weather conditions • For BIP, we must apply performance relative to the FSL to ex ante reference load • We calculate FSL performance at the industry level separately for each IOU
PG&E’s systemwide test event was called on July 2, 2013 • PG&E’s BIP customers delivered 216 MW of load reduction • On average PG&E BIP customers achieved 95% FSL compliance • Manufacturing accounts for 63% of the load reduction • Agriculture, Mining and Construction achieved 104% FSL compliance
PG&E also called a retest event on August 27 • PG&E retested 63 BIP participants who did not comply with the July 2 event • The retest event resulted in 133.6 kW in load drop on average, however that is only 46% of the load drop required to reach the aggregate FSL of 174 kW • A mild improvement over these customers’ 35% FSL performance on the July 2 event day • An average of test and retest FSL performance was passed through to over/under performance estimates used for ex ante
SCE’s test event was on September 19 • SCE’s BIP customers delivered 687 MW of load reduction • On average SCE BIP customers achieved 94% FSL compliance • Manufacturing accounts for 67% of the load reduction • Agriculture, Mining and Construction achieved 100% FSL compliance but Institutional/Government achieved 152% (but note n = 5 here)
SDG&E’s test event was on September 5 • SDG&E’s BIP customers delivered 1.5 MW of load reduction • On average SDG&E BIP customers achieved 102% FSL compliance • A big improvement over 2012 which was 34%
BIP is forecast to deliver 886 MW of load impacts for a 1-in-2 weather August system peak day • 51% of BIP’s load impacts come from SCE’s Los Angeles Basin Load Capacity Area (LCA) • All IOUs will need to keep BIP load impacts under the emergency DR cap (will lower to 2% of all-time CAISO peak load in 2016) Ex Ante Load Impact - MW
BIP ex post and ex ante impacts enjoy a direct connection PG&E SCE SDG&E
For comments or questions, contact:Candice Churchwell CChurchwell@nexant.comorNexant, Inc.101 Montgomery St., 15th FloorSan Francisco, CA 94104415-777-0707