February 2008
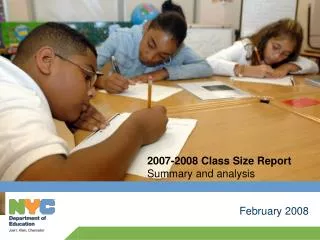
2007-2008 Class Size Report Summary and analysis. February 2008. Executive Summary.

February 2008
E N D
Presentation Transcript
2007-2008 Class Size Report Summary and analysis February 2008
Executive Summary • In December 2007, the DOE released reports showing preliminary class size information for the 2007-2008 school year based on active registers as of 12/07/07. The current 2007-08 Class Size Report has been updated with active register data as of 1/23/08. • These reports provide more and clearer detail than reports in the past, in order to give parents and policy makers a clearer view of class size in New York City schools. • These reports show measurable progress toward class size reduction goals, both across the City and in the schools targeted for coaching this year. • A report based on end-of-year registers will be available in July.
DOE Class Size Reporting DOE’s Class Size Reporting: The attached materials are the class size report for 2007-2008 School Year, based on active registers in schools as of 1/23/2008. This report provides updated data from the Preliminary Class Size Report, which was published in December 2007, and reflects the register adjustments and course coding corrections that occurred over the months of December and January. An additional report will be published at the end of the school year. Improvements in Reporting: The 2007-08 reports include several improvements that make class size information more transparent. • More detailed information on class size, including information on total register at each grade, the number of classes counted, and the largest and smallest class at each grade level. • A different and more intuitive definition of HS class size, focused on the actual size of core courses rather than the grade level of students. • A variety of reports, including two school level reports, summary tables by both borough and district, and charts showing the distribution of class size.
Reports Available On-Line • The following reports are available on the DOE website: • Aggregate School Data: showing average class size for each school by grade span (K-3, 4-5, 6-8, 9-12) and service type (General Education, Collaborative Team Teaching, Self-Contained Special Education, Gifted and Talented) • Detailed School Data: showing average class size data by grade for each school • District, Borough, and Citywide Summaries: showing both summary information and the distribution of class sizes • Detailed explanation of methodology • Glossary of key terminology used in the class size report • Core definitions of class size: • ES and MS class size: based on the “official class” in which a student is registered. Typically, this is the student’s homeroom. However, the student may be in different classes, with different sizes, through the course of the day. • HS Class size: records the average class size by course necessary for graduation (i.e. English 9), and does not include electives (i.e. Journalism). This definition is a change consistent with outside input the DOE received, made in order to more clearly define high school class-size. This changed definition makes direct comparison to last years data difficult, since last year’s data focused on the number of students in a given grade level, included electives, and, in the case of the Contract for Excellence Target, was calculated from an end-of-year register.
About Our Source Data • We are standardizing reports to use point-in-time snapshots: • Prior DOE reports used a combination of point-in-time “snapshots” and audited register files for class size reporting, depending on grade level and time of year. • Beginning with the December 2007 report, we will only use point-in-time snapshots taken shortly before the reporting date. • What this means: • The number of official classes and sections fluctuates throughout the year as registers, schedules, and student programs change. Using point-in-time snapshots allows these changes to be reflected in the Class Size Reports. • Principals will be able to correct coding errors and update data throughout the year. • Enrollment is highest at school opening and declines as the year progresses. This normal register fluctuation will affect average class size reports.
Class Size – Summary Data 2007-08 Average Class Size (1/23/2008) All* GE CTT G&T Special Class 6:1:1 4.5 K-3 20.9 20.9 20.9 21.9 8:1:1 7.3 4-5 23.8 23.8 23.2 25.3 K-8 12:1 10.6 12:1:1 10.3 6-8** 25.9 26.1 24.0 25.9 15:1 9.0 9-12 26.1 26.2 22.0 Grades 9-12 Social Studies 26.7 26.9 22.1 Social Studies 11.7 English 25.6 25.8 21.9 English 11.2 Science 26.7 26.8 22.5 Science 12.0 Math 25.3 25.4 21.5 Math 11.9 * Excludes self-contained special education classes ** Includes 9th grades residing in Jr. High Schools (i.e. 6-9 schools)
Issues of Note in Analyzing Data Issue Next Steps Middle school class size is based on the “official class” of students, which is typically their homeroom. This information therefore may not reflect the actual academic experience of students, who in many middle schools are reorganized from their homerooms when they go to academic classes and are divided into sections of different size and composition • DOE is pursuing system improvements that will allow us to track academic class sizes in middle school. Middle School Class Size Metric • DOE is checking classes that exceed the maximum to establish which have already been resolved in arbitration • Sampling will continue to identify data errors and coding changes. The contract with the UFT specifies maximum class sizes by grade level or subject and describes the available exceptions. This report includes classes that appear to exceed contractual class size limits; however, a sampling of oversized classes revealed that many of these classes reflect coding issues rather than actual student experience of class size. For instance, in middle schools, many oversized classes are actually large homerooms that are divided into sections throughout the day; Independent study courses, where many students are grouped together for data tracking purposes, are another example. Many classes alleged to be oversized by the UFT have already been scheduled or are in the process of being scheduled for arbitration at which time the issue is either resolved or a determination is made by the arbitrator. Oversized Classes Based on a sampling of high school data, it appears that many high schools are coding the General Education and Special Education portions of CTT classes as distinct class sections in HSST although the two parts meet as one class. • Clarify coding conventions for CTT classes for reporting in the 2008-2009 school year. High School CTT Reporting • Publish class size reports based on point-in-time snapshots in order to track impact on class size through the year and ensure comparability of year to year data. The number of students enrolled in NYC schools changes throughout the year as students move into and out of the system mid-year. Even the official register as of a particular day - such as 10/31 - changes depending on when the data is viewed, because the effective day of a student discharge is several months earlier than when that action is recorded in the system. Register Fluctuation
NYC DOE 5-year Class Size Reduction Plan Increased school resources • 50% of this year’s Contract for Excellence, and at least 25% of future C4E funds, will be devoted to class size reduction. As of 10/31 schools had hired approximately 1300 additional teachers. Policy Adjustments • Last year, the DOE restructured both enrollment and facilities policies to protect schools that invested resources in class size reduction. • Empower and enable individual schools to invest in class size reduction, consistent with the school’s overall plan to improve student achievement New construction • The City has scheduled construction of 105 new school buildings citywide under the current 2005-2009 capital plan, which is expected to result in new classroom capacity in the immediate vicinity of 90% of the currently over-utilized buildings in the system. Guidance and coaching • Over the summer, the DOE identified 78 schools for targeted coaching to reduce class size. 50 schools will be added to this program each year. Reporting and Tracking • The DOE committed to clarify and standardize class size reporting. The current publication reflects our progress toward that goal.
Class Size Reduction Targets Baseline 06-07* C4E Target* February 2008* Preliminary Change K-3 21.0 20.7 20.9 -0.1 4-8** 25.6 24.8 25.0 -0.6 Adjustments to the high school methodology make the baseline/target from last year not directly comparable to preliminary results from this year. The DOE’s end of year target in high school is a 0.6 reduction in class size. However, using last year’s high school methodology, schools are showing an average reduction of approximately 0.6 students/class between last year’s average class size and this year’s average class size. See the following slide for this data. 9-12 • Preliminary class size shows measurable and substantial progress toward goals established in Class Size Plan • Ongoing register reductions that occur every school year between January and June may produce lower class sizes in the end of year reports * Excludes self-contained special education classes ** Includes 9th grades residing in Jr. High Schools (i.e. 6-9 schools)
High School Class Size, Using Last Years Methodology, Also Demonstrates Reductions average change: -0.6 average % change: -2.2% FY2007 based on 12/15/06 active register FY2008 is based on 1/23/08 active register *In FY2007, active registers declined by approximately 1% between the middle of December and the end of January
Class Size K-8 has dropped consistently • HS data not comparable, so not included Source: FY2002 - FY2007 Mayor’s Management Report (MMR) and 2008 Preliminary Class Size Report. MMR data is based on audited registers. Average class size above do not include CTT or Self-Contained classes.
Class Size Reduction is Focused in Schools That Started with the Largest Class Size
Coaching Program is Demonstrating Substantial Impact with Targeted Schools • 64* Coaching Schools with ES/MS Grades – Target First Year Reduction of 5% • K- 8 February Average Class Size: 26.9 • 1-Yr Change: -1.3 students/class • 1-Yr Percent Change: -4.6% • 53 Schools reduced K-8 ACS • Avg. Reduction: -6.2% • Largest Reduction: -20.0%** • 11 Schools increased K-8 ACS • Avg. Increase: 3.1% • Largest Increase: 8.8% -9 of 11 are middle schools that are doing targeted CSR- These reductions do not show up in DOE data system, which only tracks official classes (i.e. homerooms). -1 of 11 is implementing an approved alternative plan to improve student achievement. -1 of 11 is targeting students performing at L1 and L2 by placing them in smaller official classes on their grade level. * 64 schools excludes 7 coaching schools with HS grades (4 HS and 3 MSHS) where FY07 and FY08 class size methodologies are not comparable, as well as one school whose class size is not accurately captured in our methodology due to a high number of bridge classes. ** This is a MS that reported “split sections” in ATS. Most middle schools do not report this way, although there are others in the coaching sample who are splitting sections but only reporting official classes.
Next Steps in Class Size Reporting • Class Size Reporting: • Publish end-of-year Class Size information in July for Contract for Excellence comparison • Continue to improve accuracy of course coding and data collection • Improve system reporting for detailed Middle School course section data • Address course coding conventions that may result in anomalous class size data (e.g. CTT classes, multi-grade bridge classes, and independent studies) • Continue planning for 2008-2009 CSR Coaching Program, and refinement of DOE 5-year Class Size Reduction Plan