
Trigonometric Functions Translations & Models
Learn how to graph translations of sine, cosine, and tangent functions, and model scenarios using trigonometric functions with step-by-step examples.

Trigonometric Functions Translations & Models
E N D
Presentation Transcript
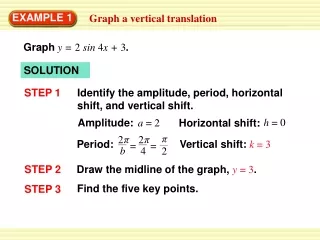
π π 2 2 b 4 h = 0 Amplitude: a = 2 Horizontal shift: π 2 Period: Vertical shift: k = 3 = = EXAMPLE 1 Graph a vertical translation Graphy = 2 sin 4x + 3. SOLUTION Identify the amplitude, period, horizontal shift, and vertical shift. STEP 1 STEP 2 Draw the midline of the graph, y = 3. Find the five key points. STEP 3
On y = k: (0, 0 + 3) = (0, 3); ( , 0 + 3) π = ( , 3); = ( , 3) ( , 0 + 3) 2 = ( , 5) Maximum: ( , 2 + 3) 3π ( , –2 + 3) 3π 8 Minimum: = ( , 1) π π π π π 8 4 8 2 8 4 EXAMPLE 1 Graph a vertical translation Draw the graph through the key points. STEP 4
π π 2 2 b 2 h = 3π Amplitude: a = 5 Horizontal shift: Period: Vertical shift: π k = 0 = = EXAMPLE 2 Graph a horizontal translation Graphy = 5 cos 2(x – 3π ). SOLUTION Identify the amplitude, period, horizontal shift, and vertical shift. STEP 1 STEP 2 Draw the midline of the graph. Because k = 0, the midline is the x-axis. Find the five key points. STEP 3
15π 13π On y = k: = ( , 0); ( + 3π,0) 4 4 3π ( + 3π,0) 4 = ( , 0) = (3π, 5) Maximum: (0 + 3π, 5) (π+ 3π, 5) = (4π, 5) π π 7π 4 ( + 3π, –5) = ( , –5) Minimum: 2 2 EXAMPLE 2 Graph a horizontal translation Draw the graph through the key points. STEP 4
Ferris Wheel Suppose you are riding a Ferris wheel that turns for 180seconds. Your height h(in feet) above the ground at any time t (in seconds) can be modeled by the equation h = 85 sin (t – 10) + 90. π a. Graph your height above the ground as a function 20 of time. EXAMPLE 3 Graph a model for circular motion b. What are your maximum and minimum heights?
2π a. The amplitude is 85 and the period is = 40. The wheel turns = 4.5 times in 180 seconds, so the graph below shows 4.5 cycles. The five key points are (10, 90), (20, 175), (30, 90), (40, 5), and (50, 90). π 20 40 180 EXAMPLE 3 Graph a model for circular motion SOLUTION
b. Your maximum height is 90 + 85 = 175feet and your minimum height is 90 – 85 = 5feet. EXAMPLE 3 Graph a model for circular motion
Graphy = –2 sin (x – ). 2 3 2 π π 3 2 Amplitude: Horizontal shift: a = –2 = 2 h = 2 2π 2π = period : = 3π Vertical shift: k = 0 2 b EXAMPLE 4 Combine a translation and a reflection SOLUTION STEP 1 Identify the amplitude, period, horizontal shift, and vertical shift. Draw the midline of the graph. Because k = 0, the midline is the x-axis. STEP 2
STEP 3 Find the five key points of y = –2 sin (x – ). 3π 9π 7π 5π 3π π π π π π π ( + ,2) ( + ,0) ( + ,–2) On y = k: = ( , 0); (0 + ,0) = (2π, 0) 4 4 2 4 2 2 2 2 2 2 2 = ( , 0) (3π+ ,0) 2 π = ( , 2) 2 3 Maximum: 11π ( , –2) Minimum: = 4 STEP 4 Reflect the graph. Because a < 0, the graph is reflected in the midline y = 0. EXAMPLE 4 Combine a translation and a reflection
5π So, ( , 2) becomes ( , –2 ) 4 5π 11π 4 and becomes . ( , 2) 4 11π ( , –2) 4 EXAMPLE 4 Combine a translation and a reflection STEP 5 Draw the graph through the key points.
π Period: h = 0 Horizontal shift: k = 5 Vertical shift: Find the asymptotes and key points of y = –3 tanx + 5. EXAMPLE 5 Combine a translation and a reflection Graph y= –3tanx + 5. SOLUTION STEP 1 Identify the period, horizontal shift, and vertical shift. STEP 2 Draw the midline of the graph, y = 5. STEP 3
π Asymptotes: = x = x = ; – = 2 1 On y = k: = (0, 5) (0, 0 + 5) (– , –3 + 5) Halfway points: = π π (– , 2); 2 2 π π π π π π = π – 4 4 4 4 4 4 2 1 ( , 3 + 5) ( , 8) So, (– , 2) becomes π (– , 8) 4 ( , 8) and π becomes ( , 2) . 4 EXAMPLE 5 Combine a translation and a reflection STEP 4 Reflect the graph. Because a < 0, the graph is reflected in the midline y = 5.
EXAMPLE 5 Combine a translation and a reflection STEP 5 Draw the graph through the key points.
Glass Elevator You are standing 120 feet from the base of a 260 foot building. You watch your friend go down the side of the building in a glass elevator. Write and graph a model that gives your friend’s distance d(in feet) from the top of the building as a function of the angle of elevation q . EXAMPLE 6 Model with a tangent function
opp 260 – d adj tanq = = 120 120 tanq 260 – d = 120 tan q– 260 – d = d –120 tan q+ 260 = EXAMPLE 6 Model with a tangent function SOLUTION Use a tangent function to write an equation relating dand q . Definition of tangent Multiply each side by 120. Subtract 260 from each side. Solve for d. The graph of d = –120 tanq + 260 is shown at the right.


