Download
1 / 58
590 likes | 606 Views
Learn about diagnostic methods for powerful ion beams: Faraday cup, Thomson Parabola spectrometer, thermal imaging diagnostics, and more. Explore waveforms, ion current densities, and analyses for precise diagnostics. Enhance your understanding of high-current pulsed ion beams.

E N D
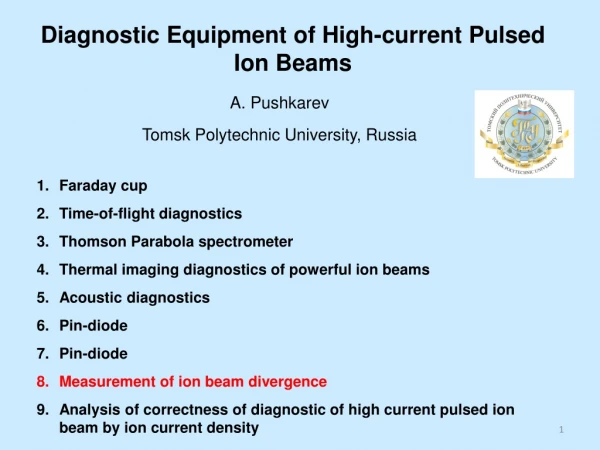
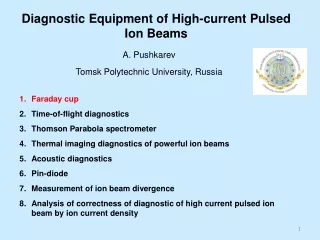
Diagnostic Equipment of High-current Pulsed Ion Beams A. Pushkarev Tomsk Polytechnic University, Russia Faraday cup Time-of-flight diagnostics Thomson Parabola spectrometer Thermal imaging diagnostics of powerful ion beams Acoustic diagnostics Pin-diode Measurement of ion beam divergence Analysis of correctness of diagnostic of high current pulsed ion beam by ion current density
1. Faraday cup with magnetic cut-off Diode connection of the TEMP-4M accelerator Waveforms of accelerating voltage, total current and ion current density
Electron beam To osc. 1.1. Faraday cupfor electron beam Ie = U/RFC RFC U RFC = 0,0485 Ohm Waveforms of (1) electron current and (2) voltage
Vacuum (P<10-4Torr) Plasma 1.2. Faraday cupfor ion beam
Faraday cup without magnetic insulation (electron cut-off) For measuring the charge neutralization of beam, formed by a diode, we used a Faraday cup without magnetic insulation of electrons . Connection CP-50 Hole 4 mm cathode anode shield The construction of a Faraday cup without magnetic insulation of electrons 5
Waveforms of the accelerating voltage and ion current density Electron concentration (2.5-6)1012cm-3. Pushkarev A.I., Isakova Yu.I., Khailov I.P. The influence of a shield on intense ion beam transportation // Laser and particle beams (2013), volume 31, issue 03, pp. 493-501.
Осциллограммы ускоряющего напряжения, второй импульс (1), плотности тока нейтрализованного пучка (2), плотности ионного тоа с КЦФ,закрытым фольгой 10 мкм (3), плотности ионного тока (4, точки), расчетная плотность тока протонов (5, линия) и ионов углерода (6, линия)
S ions + electrons B N B е Faraday cup with magnetic insulation of electrons vion = ve To osc. Eion = 200 keV Ee ≈ 0.1 keV ions + electrons
Ion current density U(t) Faraday cup with magnetic insulation of electrons
Анод-латунь Skin effect is the tendency of an alternating electric current (AC) to become distributed within a conductor such that the current density is largest near the surface of the conductor, and decreases with greater depths in the conductor. The skin effect is due to opposing eddy currents induced by the changing magnetic field resulting from the alternating current. 24 mm The distribution of magnetic induction in the cross section of the diode along the surface of the grounded electrode at distances of 1 mm (1) and across the A-C gap in the center of the diode (2)
Magnetic filed weakens in plasma by a factor of 2.7 in the depth of: 24 mm ELCUT The distribution of magnetic induction in the cross section of the diode across the A-K gap in the center of the diode
Ion current density: where z – ion charge (1.6·10-19 C), ni –ion concentration, vi – ion velocity. The concentration of ions in the beam is then: For ion beam with single-ionization ions and full charge neutralization e = z, ne = ni. Velocity of ions in transportation region (after acceleration in A-K gap) can be calculated as: Concentration of ions in the beam:
S B N The thickness of the skin layer in the ion beam is then: With accelerating voltage in V and ion current density in A/m2. Calculated values of thickness of the skin layer at different accelerating voltage
S B N Waveforms of the accelerating voltage (second pulse) and the thickness of skin-layer 14 14
1.2. Faraday cup with electrical bias e ions + electrons e to oscill. The distance at which electric field applies in plasma is determined by the Debye radius. Outside the sphere of Debye length electric field is screened by the polarization of the surroundings. Voltage
Debye length is: 0 - absolute dielectric constant, k – Boltzmann constant, e - electron charge, ne – concentration of thermal electrons in ion beam. For an ion beam with singly ionized ions at full charge neutralization e = z, ne = ni. Then Debye radius is equal to: Debye radius for C+ ions is equal to: With accelerating voltage in V and ion current density in A/m2.
Calculated values of Debye radius for thermal electrons in ion beam (Te = 300K) at accelerating voltage of 100 (1), 200 (2) and 300 kV (3) Calculated values of the thickness of skin layer of ion beam at different accelerating voltages When using a Faraday cup with electrical bias the diameter of ion beam should be a few microns that when the ion current density of 30-150 A/cm2 and a load resistance of 50 ohms provides a very weak signal. Therefore, a more promising method if Faraday cup with magnetic insulation.
18 18
Control of Faraday cup by IR-diagnostic IR-diagnostic was used for controlling Faraday cup measurements (diode with external magnetic insulation). The studies were performed on the ТЕМP-4M accelerator with the use of the same diagnostic equipment as for studies of an ion diode with the self-magnetic insulation. ORIGIN 8.1 Waveforms of the (1) accelerating voltage, (2) total current, and (3) ion-current density in the diode with external magnetic insulation The calculated energy density was 3.4 J/cm2.
Thermal imaging diagnostics Ion beam thermal imprint in the focal plane of the focusing strip diode and the energy density distribution in the horizontal and vertical sections. The calculated energy density was 3.4 J/cm2 Isakova Yu.I., Pushkarev A.I. Thermal imaging diagnostics of powerful ion beams // Instruments and Experimental Techniques, 2013, Vol. 56, No. 2, pp. 185–192
H. A. Davis, R. R. Bartsch, J. C. Olson, D. J. Rej, and W. J. Waganaar.// J. Appl. Phys. 82 (7), 3223 (1997).
Absorbed energy density (IR-diagnostic) compared to incident energy density (oscillograms U+I)
The total ion current monitor The Mercury ion diode, showing locations of current monitors; (bottom) details of the ion current monitor. D. D. Hinshelwood, et al. High-Voltage, High-Impedance Ion Beam Production // Proceedings of the 17th IEEE Pulsed Power Conference, Washington, DC, 2009, edited by F. Peterkin and R. Curry (IEEE CF09PPC-DVD, Piscataway, New Jersey, 2009), p. 227.
Diagnostic Equipment of High-current Pulsed Ion Beams A. Pushkarev Tomsk Polytechnic University, Russia Faraday cup Time-of-flight diagnostics Thomson Parabola spectrometer Thermal imaging diagnostics of powerful ion beams Acoustic diagnostics Pin-diode Measurement of ion beam divergence Analysis of correctness of diagnostic of high current pulsed ion beam by ion current density
2. Time-of-flight diagnostics Faraday cup Waveforms of voltage and ion current density (dots-exp., lines-calc.) in the planar diode. The estimated current density of C+ ions, when K2 = 7, and the estimated current density of protons, when K2 = 2. The distance to the Faraday cup is 11 cm
Beam composition and ion current density investigations Toanalyzethecompositionoftheionbeamformedbythediode, a time-of-flightdiagnostic, basedon a singlehigh-speedsensor (Faradaycupwithmagneticinsulation) wasused. It was assumed that • different types of ions are formed simultaneously during the accelerating voltage pulse • their drift velocity does not change. The ion beam density, formed by the TEMP-4M accelerator, does not exceed 1013 cm-2, so the probability of collision (and velocity change) in the drift space is low. For each instant of time that the voltage is applied to the diode (time step interval of 0.4 ns), we calculated the current density of certain ion types and the arrival delay of these ions to the Faraday cup. The calculated curves were compared with experimental data.
t J(t) Waveforms of voltage and ion current density Y.I. Isakova, А. I. Pushkarev and V. А. Tarbokov, Bulletin of the Tomsk Polytechnic University 316 (2), 76 (2010).
D= 14 cm D= 17 cm Waveforms of voltage and ion current density (dots-exp., lines-calc.) in the planar diode. The estimated current density of C+ ions, when K2 = 7, and the estimated current density of protons, when K2 = 2.
Energy spectrum of the ions in the ion beam ORIGIN Waveforms of the ion current density (1) and kinetic energy of C+ ions (2)
Beam composition (time-of-flight diagnostic) С+(85-87)% H+ (13-15)% 30
Diagnostic Equipment of High-current Pulsed Ion Beams A. Pushkarev Tomsk Polytechnic University, Russia Faraday cup Time-of-flight diagnostics Thomson Parabola spectrometer Thermal imaging diagnostics of powerful ion beams Acoustic diagnostics Pin-diode Measurement of ion beam divergence Analysis of correctness of diagnostic of high current pulsed ion beam by ion current density
Thomson Parabola spectrometer Used for determination of the beam composition and the energy spectra of different ion species Deflection of ions in magnetic field Deflection of ions in electric field These deflections in x and y directions are proportional to ratios of charge to energy and charge to momentum, respectively. Z - charge number, M = Amp (A the mass number, mp the proton mass), E -electric field, B -magnetic field, l - length of the field in the z direction and L the length of flight path in the z direction. Ions of a fixed M/Z value make a unique parabolic trace in the x-y plane.
Thomson parabola spectrometer for different diodes Magnetically insulated diode with gas puff plasma gun (H. lto, Rev. Sci. Inst. 79. 2008) Beam produced by a plasma focus device (M.J. Rhee. Rev. Sci. Inst. 1387)
Thomson spectrometer Thomson spectrogram of the composition of an ion beam from the TEMP accelerator. G.E. Remnevet al. High-power ion beam sources for industrial application // Surface and Coatings Technology 96 (1997) 103-109
Diagnostic Equipment of High-current Pulsed Ion Beams A. Pushkarev Tomsk Polytechnic University, Russia Faraday cup Time-of-flight diagnostics Thomson Parabola spectrometer Thermal imaging diagnostics of powerful ion beams Acoustic diagnostics Pin-diode Measurement of ion beam divergence Analysis of correctness of diagnostic of high current pulsed ion beam by ion current density
Распределение энергии МИП в фокусе диода: 1 – горизонтальное сечение; 2 – вертикальное сечение C.E. Christodoulides., J. H. Freeman. Ion beam studies Part II: A calorimetric method for ion beam studies // Nuclear Instruments and Methods. 1976. Vol. 135. № 1. P. 13–19.
4. Thermal imaging diagnostics of powerful ion beams SmartView™ Isakova Yu.I., Pushkarev A.I. Thermal imaging diagnostics of powerful ion beams // Instruments and Experimental Techniques, 2013, Vol. 56, No. 2, pp. 185–192
H. A. Davis, R. R. Bartsch, J. C. Olson, D. J. Rej, and W. J. Waganaar // J. Appl. Phys. 82 (7), 3223 (1997).
Unfocused beam energy density. The outer diameter of the beam is 29 cm. The beam profile for the focused beam. The outer diameter of the beam footprint is 15 cm.
Calibration of the IR-diagnostic Fluke TiR10 Diode assembly scheme Градуировочный график для окна из CaF2 (1) и BaF2 (2)
The amount of energy Q, released in the target under exposure is equal to The energy density calculation where сv is the specific heat capacity, S is the area of the target, d is the thickness of the target, ρ is the density, and ΔТ is the target heating. Then, the PIB energy density J(x, y), J/cm2: When the temperature sensitivity of Fluke TiR10 IR camera is equal to 0.2 °C, the minimum energy density (for 0.2mm metal target), taking into account attenuation of the heat flow in the output window, is 0.1 J/cm2. When viewing angle of 25º and minimum focus distance of 30 cm the size of the object will be L = 30 cm·sin 25 = 12.7 cm. At 140 pixels in the matrix Imager Fluke TiR10 spatial resolution is 0.9 mm.
The time required for raising the temperature of the target After target heating by ion beam, the temperature of the other surface was viewed with the infrared camera. The time τ0.5, required for raising the temperature of the rear (with respect to beam) surface of the target by 50% from the maximum can be calculated from the ratio where d is the thickness of target; a is the thermal diffusivity. For a 220 μm brass target the heating time over the entire thickness does not exceed 0.25 ms.
Вработе [[i]] представленырезультатырасчетапродолжительности прогрева мишени te, которое соответствовало выравниванию температуры по глубине с градиентом лицевой и тыльной сторон мишени менее 0.02 K. Результаты расчета для мишени из нержавеющей стали показаны на рисунке Зависимость продолжительности прогрева мишени от ее толщины Xiao Yu, Jie Shen, Miao Qu, Haowen Zhong, Jie Zhang, Yanyan Zhang, Sha Yan, Gaolong Zhang, Xiaofu Zhang, Xiaoyun Le. Distribution and evolution of thermal field formed by intense pulsed ion beam on thin metal target // Nuclear Instruments and Methods in Physics Research B 365 (2015) P. 225–229.
Study of target cooling The X-ray absorbed dose for one pulse at a distance of 20 cm from the output flange of the accelerator exceed 0.5 mSv at a daily rate of 6 mSv. t = 2 s t = 6 s t = 9 s The distribution of the stainless steel target temperature in the horizontal section
1. Охлаждение за счет теплового излучения Для расчета охлаждения мишени за счет теплового излучения по экспериментальным значениям температуры мишени рассчитаем мощность теплового излучения. При охлаждении мишени необходимо учитывать тепловой поток с лицевой и тыльной сторон мишени, а также тепловой поток с камеры на обе стороны мишени. Тогда плотность мощности теплового излучения мишени по закону Стефана-Больцмана равна: где 1 и 2 – степень черноты лицевой и тыльной сторон мишени, = 5.6710-12 Вт/(см2·К4); T(x,y,t) – температура мишени в момент времени t, T0 – температура камеры.
Плотность тепловой энергии в мишени равна: где сv и ρ -удельная теплоемкость и плотность материала мишени соответственно, d - толщина мишени, ΔТ (x,y,t) – нагрев мишени. Экспериментальные значения плотности мощности потерь энергии в мишени рассчитывали дифференцированием изменения плотности тепловой энергии в мишени при охлаждении:
Уменьшение (при охлаждении) температуры мишени в точке максимального нагрева (1),расчетной плотности мощности теплового излучения (2) и экспериментальных значений плотности мощности потерь энергии в мишени в этой точке (3)
Экспериментальные значения плотности мощности потерь энергии в мишени в точке максимального нагрева (1), расчетная плотность мощности теплового излучения в этой точке (2), плотность мощности отвода тепла за счет теплопроводности (3) и плотность мощности отвода тепла дополнительнымпроцессом потребления энергии (4)
Разрешающая способность тепловизионной диагностики Термограмма МИП и распределение плотности энергии. Отверстие 3 мм, окно из BaF2
11.1. Study of a strip planar diode with self-magnetic insulation Schematic of the strip planar diode with self-magnetic insulation: potential electrode (1), grounded electrode (2); collimated Faraday cup (3), and Rogowski coil